


How REITs Grow Earnings

It is really a shame that this subject is so poorly understood.
This article is intended to provide a crisp, clear discussion of how REITs grow their earnings. I learned the subject from three-time REIT CEO Chris Volk. His book, The Value Equation, extends these ideas more broadly beyond REITs.
Here, though, the focus is REITs and specifically on earnings from rents on leased properties. This is the dominant source of revenues for nearly all REITs. The others, such as billboard REITs, I would label RINOs — REITs In Name Only.
Many REITs do have additional earnings streams. These are rarely dominant, though. And they must be explored case by case. Here we are after the big picture.
Mechanisms of Earnings Growth
REITs employ some or all of the following to fund growth. And the mix changes over time.
Growth of rents. Many leases include rent escalators. Lease renewals often include changes in rents.
Reinvestment of retained cash.
Recycling of capital by selling some properties.
Issuing new stock.
Debt-funded growth. There can be growth funded entirely by new debt. More often any new debt is leverage-neutral and complements other mechanisms.
Each of these mechanisms has unique features. We will discuss them in turn.
The growth that is funded can occur in at least three ways. New properties can be acquired; new properties can be developed; and existing properties can be redeveloped.
To make our discussion tractable, we will characterize growth in one of two ways. There is Return On Equity (ROE), which is the ratio of new FAD to invested cash. And there is the cash-on-cash return, which is the ratio of new NOI to invested cash.
Here NOI is the familiar Net Operating Income. FAD is Funds Available for Distribution, which is the Cash from Operations (excluding changes in working capital) less all sustaining capex less capitalized interest. Cash from Operations is approximately cash NOI less G&A costs less interest expenses.
What investors should care about primarily are per-share Funds Available for Distribution (FAD) and its growth. FAD is intended to represent actual cash earnings that could be distributed. This is what supports dividends, dividend growth, and reinvestment.
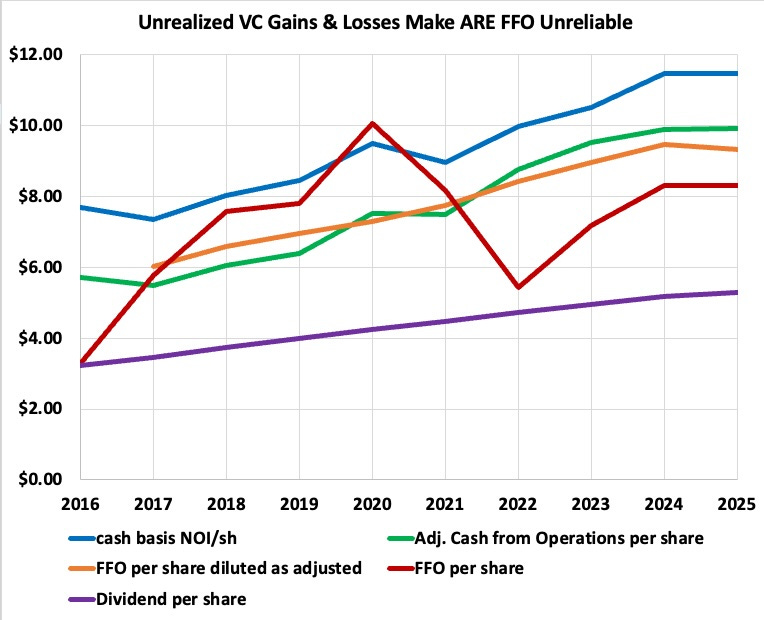
There are reasons one might focus instead on other earnings measures such as NOI/sh. The measure that is least useful is naturally the one that is most widely cited — Funds From Operations (FFO). FFO is sometimes OK but also sometimes misrepresents reality by very large factors.
The king of this is Alexandria Real Estate (ARE), at you can see in the red curve here:
Debt-funded growth (item 5) is a bit of a special case, which we will get to below.
It is also worth noting that almost all written discussion of growth, and a majority of that on earnings calls, is focused on mechanism number 4. This is the only one for which a spread between cap rates and some cost of capital is relevant.
Such spreads are often discussed in terms of a Weighted Average Cost of Capital (WACC), a terrible concept from the perspective of knowing what you are doing. Today we will leave that discussion to the linked article, though.
The total growth of FAD/sh is that produced by mechanisms 1 through 5 less any headwinds. Today an almost universal headwind is gradually increasing interest costs. This is typically reducing FAD/sh growth by 100 bps each year as debt slowly rolls over.
Another headwind at times is tenant troubles. Reduced rent is not so bad; it is loss of occupancy that really kills you.
REITs seeing some of this lately include NNN REIT (NNN) and Alexandria Real Estate (ARE), both stalwarts. Of course, the market over-reacts to these things, egged on by the chattering class seeking clicks like chickens seeking chicken feed.
That said, replacing tenants has intermediate-term impacts. In addition, seeing occupancy stabilize and reverse direction takes time and is not guaranteed. A dramatic example of the impact is seen at the moment in Orion Properties (ONL).
Now we turn to those five mechanisms.
The Five Mechanisms
1. Growth of Rents
This is very often the largest component of FAD growth. It makes sense here to focus on NOI growth (rather than revenue growth), as NOI is what drives the long-term evolution.
It also makes sense to focus on growth of cash NOI, without all the non-cash distortions introduced by GAAP accounting. A lot of REITs provide this; many others do not.
The part of NOI growth that comes from rent increases on existing leases is best characterized by “same-store” NOI growth, which excludes the impacts of new properties and of those sold. There are sector-dependent nuances here that we can ignore today.
That NOI growth may or may not be accompanied by an increase in corporate costs and interest costs. Depending how that goes, the fractional growth of FAD may be as small as the growth of NOI.
The growth rate can even be smaller if, say, interest costs are skyrocketing. This happened in 2022 and 2023 to REITs with lots of floating-rate debt. An example is Sun Communities (SUI).
On the other hand, if those various costs stay fixed, then FAD will grow faster than NOI. And various tailwinds can even increase this.
Trying to grapple with all this would take us down a rabbit hole from which we might not escape. Suffice it to say that FAD growth from rent increases will most often somewhat exceed NOI growth.
Over the past 15 years or so, same-store, cash NOI has tended to grow at 300 bps per year, give or take, for most REIT sectors. The net-lease REITs see smaller such increases, closer to 100 bps.
But that 15-year period was one of very low inflation. If we get substantial, sustained inflation then this growth rate ought to increase for many REITs including the net-lease ones.
2. Reinvestment of Retained Cash
This mechanism is the most efficient, can be large, and is widely ignored. Some REITs, such as Federal Realty Trust (FRT), have done almost none of it. But others, such as Regency Centers (REG), have relied strongly on it.
You can see which approach has been more effective:
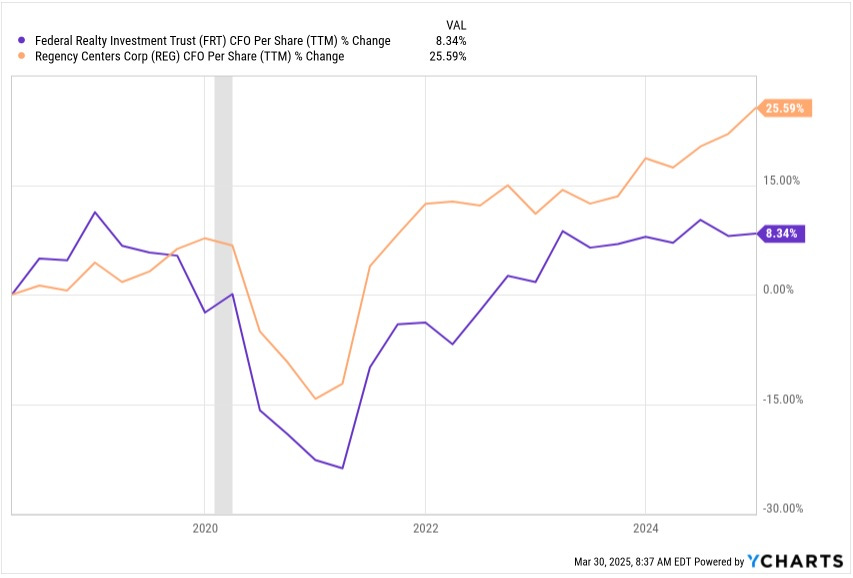
I discuss this comparison at more length in this article, from which that figure is drawn.
Other REITs have substantially increased how much cash they retained, and today are able to grow earnings more quickly as a result. EPR Properties (EPR) did this across the pandemic. W.P. Carey (WPC) used their 2023 transformation not only to shed their office properties, but also to increase retained cash.
Here is how this works. Suppose you generate 30% of FAD as retained cash available for investment. To do this you must pay out less than 70% of FAD as dividends (there are always some frictional costs preventing full reinvestment of the difference).
If you invest that 30% of FAD at an ROE of 7%, you grow FAD by about 200 bps. That is significant for any REIT. Somewhat slower growth, say 150 bps, is a more representative number.
This should seem simple because it is simple. And that ROE is most often larger than the net impact of mechanisms that come with costs to shareholders, as we will see.
3. Capital Recycling
This one is conceptually simple. First, sell properties for some proceeds at at some disposition cap rate, so that the loss of NOI is the proceeds times the cap rate. A REIT may sell complete properties or may raise funds by sales of partial ownership, often via Joint Ventures.
Second, invest those funds at some Cash on Cash return. The increase in NOI is those proceeds times the return, sometimes described as a yield. It can result from buying properties, from redevelopment, or from development.
Here we skip the nuances of timing for these different types of return. If the source of funds is steady they tend to represent a drag on capital but produce steady NOI growth.
The resulting growth of NOI is the proceeds times the difference between the Cash on Cash return and the disposition cap rate. (This is a spread that actually matters.) A typical spread is 150 bps, give or take.
So if you sell 3% of the assets (not an atypical number), and invest the proceeds at that spread, the increase in NOI is a bit less than 0.05% of the assets. This is a bit less than 0.8% of the NOI, for a 6% cap rate.
The increase of NOI does have a disproportionate impact on FAD, because these transactions often have little impact on corporate costs. Since FAD/NOI runs from a bit less that 50% to about 2/3, the net impact on FAD is in the range of 100 to 150 bps.
Capital recycling thus can be effective, but does depend on the market for dispositions. In addition, its benefits come with whatever lag there is for income from the new investments. The amount of such recycling varies a lot across REITs.
4. Issuing Stock
This mechanism becomes complicated, but does rest on the simple spread between the ROE and the FAD yield. If you issue stock with a face amount of, say, $100M then the loss/sh of FAD by current owners is $100M x FAD yield. The gain in FAD to all owners is $100M x ROE.
So the net change in FAD to all owners is $100M x (ROE - FAD Yield).
But only some of this accrues to the previous owners because the share issuance is dilutive. The change in FAD to previous owners is
$100M x (ROE - FAD Yield)/(1+$100M/Market Cap).
To find the fractional change in FAD to previous owners, one must divide by the original FAD, which equals the FAD Yield x Market Cap. Then we have, for the initial owners,
Fractional change in FAD = ($100M/Market Cap) x [(ROE/FAD Yield) - 1] /(1+$100M/Market Cap).
This is also the fractional change in FAD/sh, because the above calculation is equally valid if you divide by the initial share count throughout. Recognizing that the ratio of $100M to Market Cap here is the dilution, we can write this in a more general form as
Growth in FAD/sh from stock issuance = dilution x [(ROE/FAD Yield) - 1] /(1+dilution).
REITs growing this way tend to dilute by 5% per year, give or take. And 1.2 is not unreasonable for the ratio of ROE to FAD Yield. That gets you near 100 bps of growth in FAD/sh from this source.
This is obviously highly dependent on the variables shown. Some REITs, especially net lease REITs such as Agree Realty (ADC), tend to dilute a lot more than that.
Sometimes, such as for the Single-Family Rental sector a few years ago, the ROE can be a much larger multiple of the FAD Yield. In contrast, when stock valuations are low, as has been true for much of the period after 2021, issuing stock to grow can be dilutive to shareholder earnings. This is why many, but far from all, REITs have issued little stock during the past three years.
Here again, there is a lag between the stock issuance and the realization of new revenues. And that is on top of the lag between the sale and the actual stock issuance, in these days where “forward equity” sales dominate.
One more complication is present here. If a REIT issues stock to fund growth, the resulting dilution applies to all the other sources of earnings growth too.
So you divide by (1 + dilution). This usually is small potatoes, but it becomes important when a REIT dilutes by 20% or 30%, as Agree Realty (ADC) and other net lease REITs sometimes do.
5. Debt-Funded Growth
We will see below the role that debt normally plays in ROE. But the math changes for growth that is entirely funded by adding debt (for the math types, it is a divide by zero problem, avoiding which requires redoing the derivation).
This type of growth does happen, especially among little guys such as BSR REIT (HOM.U) behaving more like private equity types than public REIT managers. But it is not common. Most REITs have leverage targets and try to meet them.
When a REIT raises cash by issuing debt and uses only it to purchase properties, the increase in NOI is the cap rate times the New Debt. The non-interest costs, discussed further below, run from a few percent to a few tens of percent of NOI.
Now look for the ROD, for Return on Debt, as the new FAD produced by a quantity of new debt. It becomes
ROD = cap rate x ( 1 - Costs/NOI - interest rate/cap rate).
Since interest rates are rarely as small as half the cap rate, the ROD is well below half the cap rate.
So if you increase the Debt by 5% of Gross Assets, which is a lot, the increase of FAD is getting down near 0.1% of Gross Assets. With FAD in the ballpark of 5% of Gross Assets, the ballpark is 2% of FAD. But doing that would be basically a one-time thing, since increasing Debt to Gross Assets greatly impacts resiliency.
We will ignore this mechanism going forward here.
Adding These Up
So here is where we are for a REIT doing a moderate amount of the first four of these things:
Rent growth increases NOI/sh by 300 bps and FAD/sh by a bit more than that.
Reinvested cash increases FAD/sh by 150 bps.
Recycling capital increases FAD/sh by 100 bps or less.
Issuing stock increases FAD/sh 100 bps.
Various headwinds reduce FAD/sh growth by 200 bps.
This would net to FAD/sh growth of 450 bps/year. That is an excellent rate, in context. But most REITs are not doing all these things to this level.
Still, we do see REITs that grow faster than 450 bps/year for long periods. They tend to be REITs that carry very low Debt Ratios and that do development. A prime example is AvalonBay (AVB).
Two other examples or REITs that have managed this for shorter periods of time are Camden Property Trust (CPT) and Regency Centers (REG).
Also, as noted above, a REIT that issues stock also dilutes shareholders, reducing all the other components of earnings growth. This sometimes can be significant.
The Key Concepts: FAD and ROE
The one thing missing in order to apply the above is the evaluation of FAD and ROE for newly added property. We take this up here.
The ROE is the ratio of the new FAD to new cash invested, not including new debt. Let’s explore FAD further and connect the dots.
The first step is knowing Net Operating Income (NOI). The cap rate for newly purchased or created property is that property’s NOI divided by its cost. The NOI is usually straightforward, as cash rental revenues less property operating expenses (propex).
FAD overall is NOI less interest expenses less costs. Here we will ignore the nuances such as GAAP distortion of revenues and whether or not property taxes are taken to be part of propex.
Interest expenses
Interest expenses are the interest rate times the debt. If we look for the ratio of interest expenses to NOI we have
Interest expenses to NOI = (Interest rate x Debt)/(cap rate x Property Value)
= (Interest rate/cap rate) x Debt Ratio,
where the Debt Ratio is the ratio of Debt to Property Value.
This runs some tens of percent, typically,
Costs
Costs is more complex. It includes four categories:
General & Administrative (G&A) costs
Other costs whose details depend on the choices of the REIT, including what they decide are “non-operating” costs.
Sustaining capital expenditures, necessary to sustain the business and to accommodate new tenants.
Capitalized Interest, which is a way to account for actual cash expenditures without having them show up anywhere except on the balance sheet.
There is lots of nuance here that we will ignore. The costs run from less than 10% to near 50% of NOI. They very much depend on details.
FAD and ROE
With those items, FAD becomes
FAD = NOI x [1 - ({Interest rates/cap rates} x Debt Ratio) - (Costs/NOI)].
The ratio of FAD to NOI runs from perhaps 40% to about 70% across REITs.
Now if you use cash to buy properties, whether sourced from earnings, dispositions, or stock issuance, you want to know your Return On Equity (ROE). For a levered cash purchase this is
ROE = (FAD/NOI) x cap rate/(1-Debt Ratio).
It is obvious that the last factor, (1-Debt Ratio) increases ROE for increasing debt. Not so obvious is the impact of increasing debt on FAD/NOI. As Debt Ratio increases, the interest payments from debt decrease FAD/NOI. The consequences in combination are a bit non-intuitive. Look at this plot:
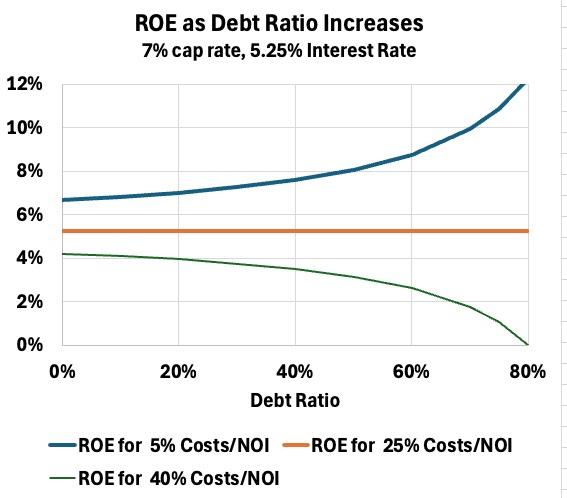
For a net-lease REIT with low costs, adding debt does boost returns. And if costs are as high as 40% of NOI, as can happen for some office REITs, then adding debt reduces the returns.
But for a shopping-center or multifamily REIT with costs at small tens of percents of NOI, adding debt makes almost no difference. For such REITs, all the debt does is let them increase the Gross Assets.
This may be good for management incentives and sometimes may be needed for scale. But most REIT CfOs seem to be ignorant of nearly all of the above, so perhaps they just carry the debt out of ignorance.
One does get periods of high costs for REITs that are doing a lot of retenanting or re-leasing. To really evaluate that would require a longer-term analysis than we are doing here. It is worth bearing in mind, though.
Impact of Troubles
Any REIT can find that its revenues decrease. This may reflect tenant bankruptcies, or decreases in occupancy as tenants do not renew.
Obviously this is most likely during broad recessions. But each sector also has its own cycles.
The impact reflects the NOI margin, too. The triple-net REITs, with their low property operating expenses (propex), can have NOI at 90% of more of revenues.
At the other extreme, for office REIT SL Green (SLG) the ratio was 67% in 2016. The simple implication would be that a 33% drop in revenues would cut NOI in half. In actuality, thanks to dispositions NOI dropped more than that.
Of more relevance is that for an NOI margin of 67%, a 10% drop in revenues decreases NOI by 15%. But these decreases in NOI will rarely if ever threaten the survival of the REIT, because dividends, at a minimum of 90% of taxable income, are always a large fraction of FAD. What gets threatened is the dividends.
Across REITs one finds quite a variation in payout ratios on FAD. Some net-lease REITs pay 70% or even less. Some REITs pay more than 90%. Starting at 90%, here is how the payout ratio changes as NOI decreases, for three values of Debt Ratio:
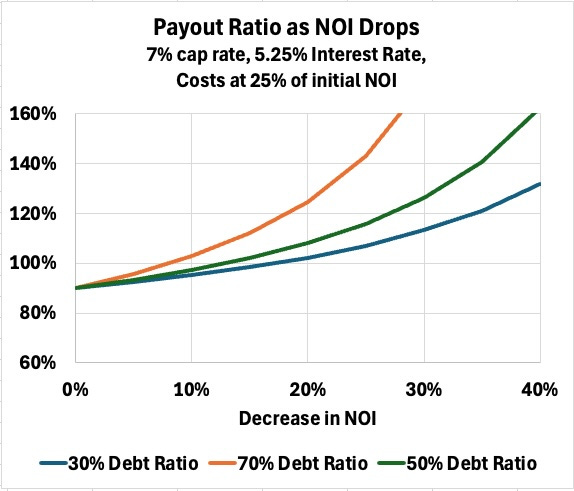
You can see how running a larger Debt Ratio puts the dividend at much greater risk. Across the interval mentioned above, SL Green diluted shareholders by 10% and cut the dividend by 20%.
Regency Centers (REG), in contrast, did not cut the dividend or increase debt across the pandemic. In fact they paid down some debt.
Takeaways
As you read REIT earnings calls you can tell what they consider important. What is their same-store or other NOI growth? Do they mention only WACC and issuing stock? Or do they emphasize retained earnings? How much prominence are they giving to dispositions?
You can see a lot of this graphically by plotting the cash flows. You will find such plots in nearly all of my deep dives.
Many REIT managements are far too focused on growing Gross Assets — growing their empire. What you really want is the ones whose focus is on growing cash earnings (per share) for shareholders, long-term. Unfortunately they do not always speak directly to this aspect.
Perhaps that is why you need me.
Please click that ♡ button. And please subscribe, restack, and share. Thanks!

Great article, wow.
FAD is like Free Cash Flow for stocks.
Paul, the missing piece is assessing the business model of the REIT?
Should be mandatory reading for REIT CFOs!