


The Value of Regency Centers


In the US there has been minimal retail construction since the Great Recession. But the narratives of the death of brick & mortar retail proved false. (Had you followed my coverage, you would have known this in advance.)
[This update corrects the value for FAD (defined below). The information in the Supplemental about capital expenditures turned out to be less complete than what was in the 10-K. Replaced text below is in italics, and the two figures replaced have italicized captions. In the event, the range of valuations is slightly broadened downward.]
By now retail space is in such demand that retail firms are buying leases out of bankruptcies at auction. This implies that they must cover transition costs usually borne by the landlord; these can exceed two years of rent.
Those landlords, including the shopping-center REITs, are now rapidly growing cash earnings as leases roll over. But this comes on the heels of a difficult decade for all of them. To set context, let’s look at that first.
The Landscape
We start in late 2016, at the onset of the “retail apocalypse.” That began the big wave of retail tenant bankruptcies that culminated in 2020. We will skip the backstory; it is mainly about debt not e-commerce.
The price action of these REITs sends the momentum-investing types running for the door:
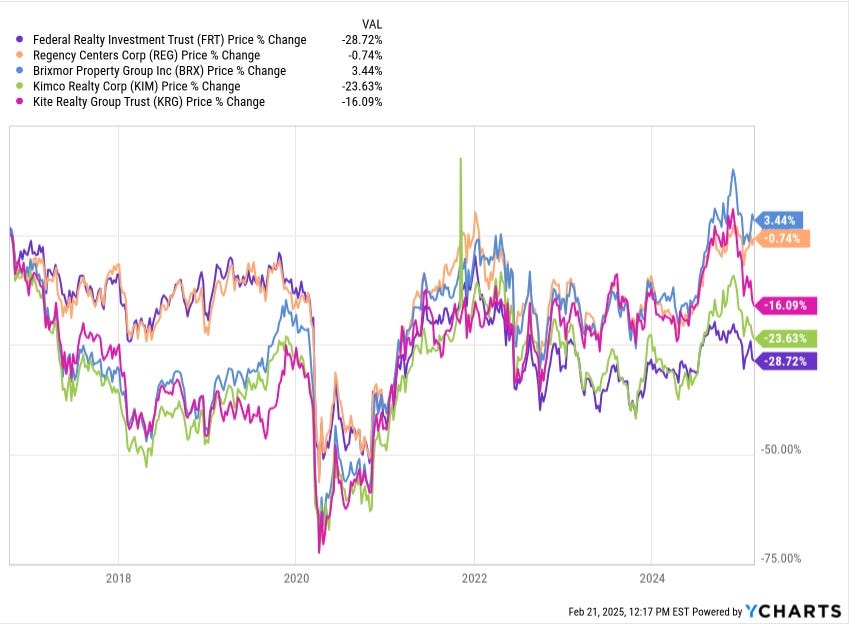
Only REG and Brixmor (BRX) are even flat. Federal Realty Trust (FRT) and Kimco (KIM) have notably fallen behind since the pandemic onset. Of course, you could have made good gains in any of them by buying in 2020, as indeed I did.
As usual, Cash from Operations per share displays the economic performance as distinct from the market performance:
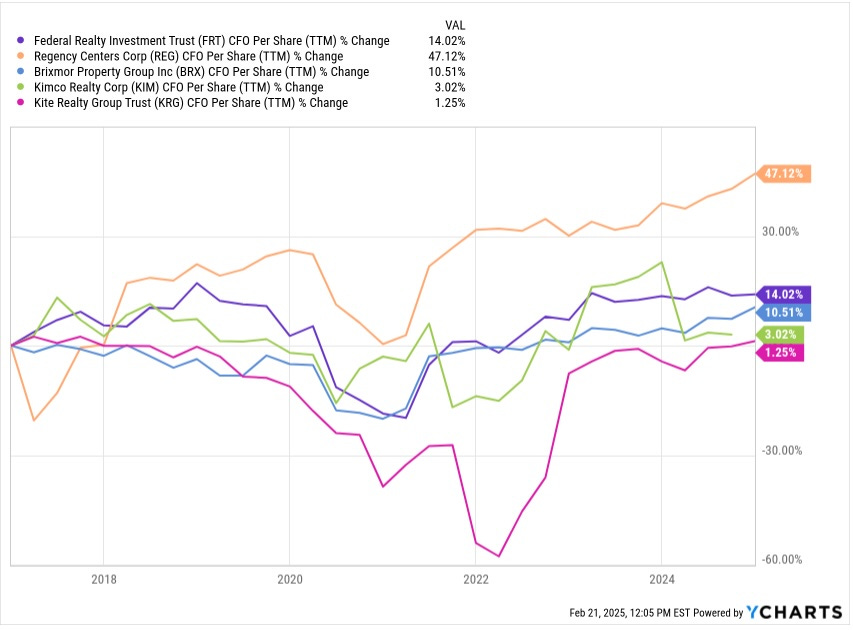
This one plot captures the important comparison in the shopping-center REIT sector. Regency has turned in strong growth by that measure, up 47% in 8 years. In several ways, this plot captures the point of the article. We just need to know how they do it and whether they can sustain it.
The others are just now showing some of that growth. The reason is (again) debt; we will say more about the specific comparison with FRT below. The ratio of Price to CfO/sh is particularly informative:
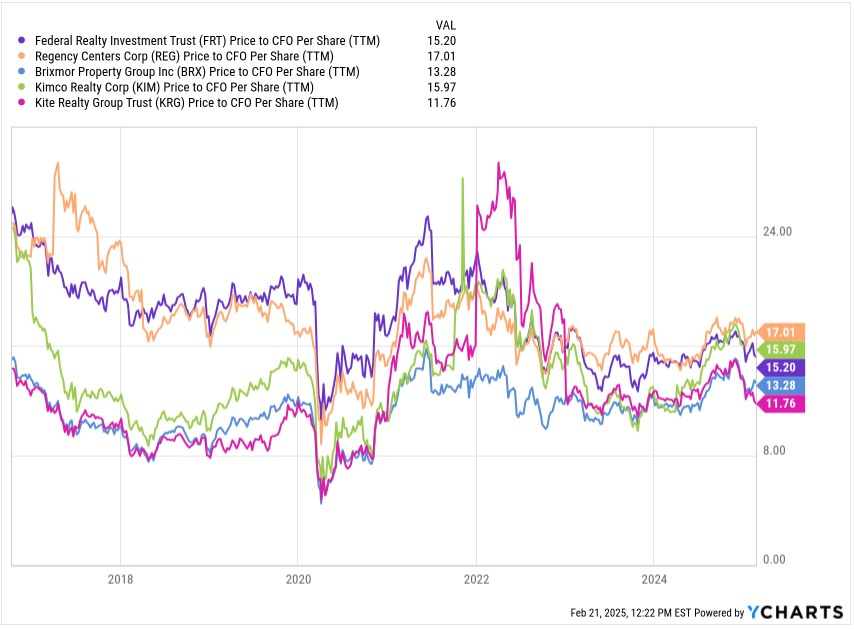
What is striking to me here is that REG and FRT and KIM are down by a third since 2016. Kite Realty Group (KRG) and BRX are down much less.
This ratio reflects both markets and reality (markets ARE NOT reality). The reality part is that increased interest rates after 2021 and the corresponding increase in cap rates do decrease the rational value of this ratio.
But are the weak sisters here really much better businesses than they were a decade ago? Maybe, maybe not, but we won’t go there today. Our question specifically will be whether the current market valuation of REG makes sense or not.
Introducing Regency Centers
The Great Recession was hard on this type of REIT, including Regency. To get through that period, they cut their dividend by a third and diluted shareholders by about 20%.
No wonder, since their Debt to Gross Assets reached 59% in 2008. But today it stands at 31%, having been no larger than 35% across the past decade.
After that recession, Regency set out to rework their portfolio, to increase its quality and resilience, and to improve their balance sheet. Again, this was common across the sector, with perhaps only Federal not needing to do much.
They again began raising the dividend in 2014. Then in 2017 they completed a very large merger, more than doubling their Gross Assets. These have grown quite slowly since, save when they merged in 2023 with Urstadt Biddle, producing a 14% increase.
This slow asset growth is not a surprise. The shopping-center game is mainly about buying underdeveloped properties, or developing new ones, getting them leased up, operating them, and opportunistically selling them. We will see how this plays out in their cash flows, below.
Here are some bullet points noting aspects of Regency:
They have 474 retail operating properties having 57M square feet of Gross Leaseable Area (GLA).
Only a few of those are in Joint Ventures.
>80% of their centers are anchored by grocery stores.
Their demographic numbers put them near the top of such REITs:
Their average population within 3 miles of their centers 124k
That population is well-educated.
The average household income in those areas is $152k.
Their spaces are 96.3% leased, with small shops at 94.1%.
Development is a key element in their business model. They currently have 6 properties in development and 9 properties in redevelopment.
Their (Net Debt plus Preferreds)-to-Operating EBITDAre is 5.2x.
They are one of only about six REITs with at least two credit ratings at the A- level.
Let me comment further about a couple of these. First, here is a summary of the portfolio composition, grouped by Annual Base Rent (ABR):
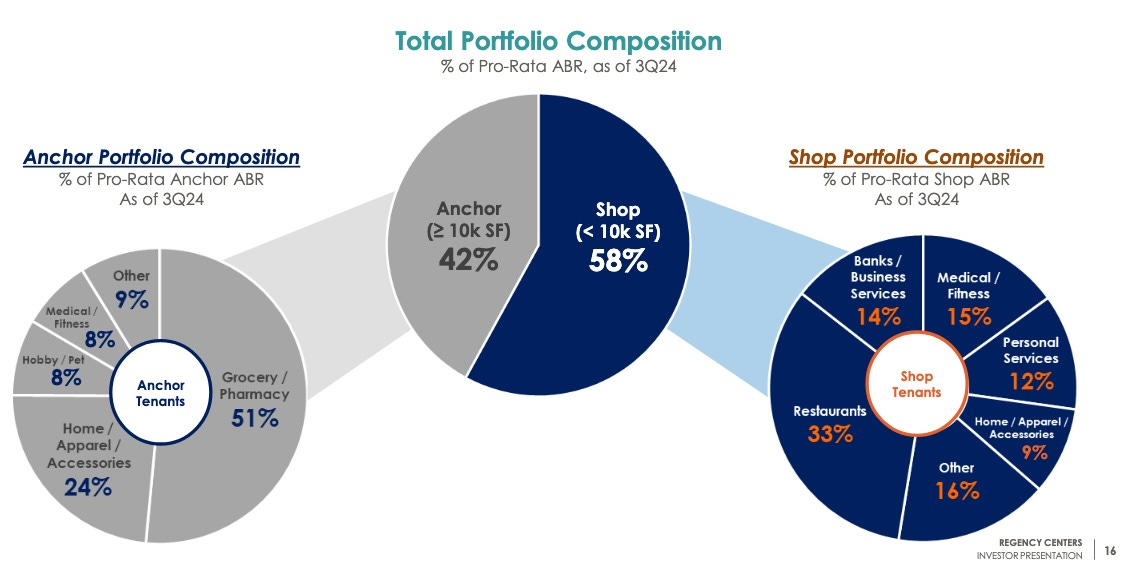
The traditional role of anchors is to draw shoppers to a center. This is critical for malls, whose traditional anchors contribute very little rent. In contrast, a substantial fraction of the Regency ABR is from anchors.
Also note that the shop portfolio is heavily weighted toward providing services as opposed to things one buys and takes away (such as apparel). This makes a center more resistant to recessions.
At present, prospects are good for also growing occupancy. First one has to get leases signed and then do the improvements that get the tenant operating and paying rent. Here is their slide on that aspect:
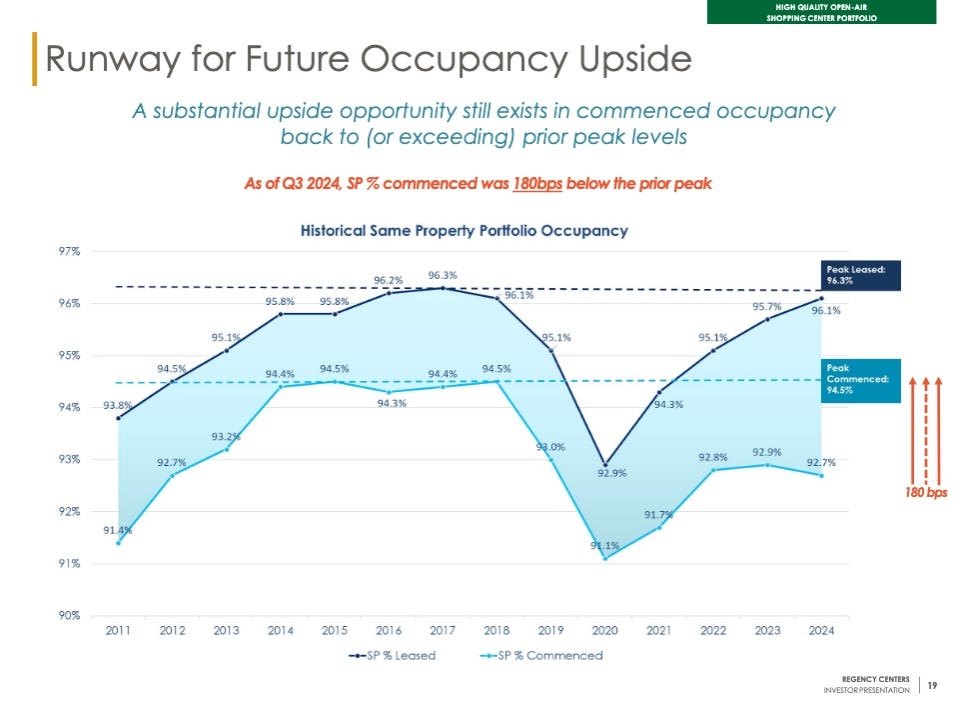
Commenced occupancy has at least 200 bps of upside and could go higher before the present arc of retail good times peaks. A 100 bps increase in occupancy increases ABR by 100 bps.
Since other costs change little, the increase to Funds Available for Distribution (FAD) is near 150 bps. And that could go on for a couple years.
Next, about that credit rating. Moody’s and S&P each have has only one shopping-center REIT at A3 or A-, which is Regency. The S&P upgrade came just this month.
For comparison, Federal Realty Trust lost their A-level rating in 2021, after they decided to increase debt to avoid cutting their dividend. But, having been more conservative with their own debt, Regency never faced that choice. (I covered the comparison in my 2024 deep dive on Regency.)
The debt maturity ladder looks like this:
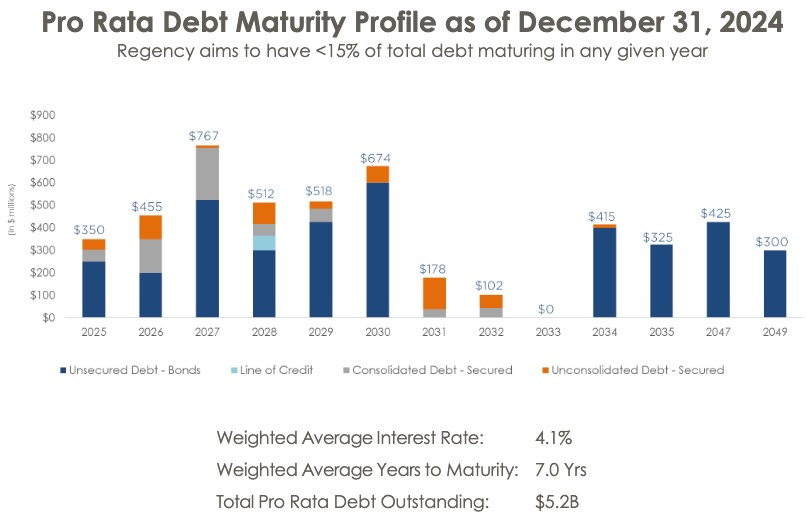
For the next 6 years, they will have to refinance about $500M per year. If rates stay high, this will produce incremental interest costs near $8M, producing a headwind to growth of 1% of CfO. This is a normal story today for a blue-chip REIT.
We will next look at their cash flows to get a sense of their business model. After that we will see how this has translated into growth of earnings measures.
Cash Flows
Here are simplified cash flows from 2018 through 2024:
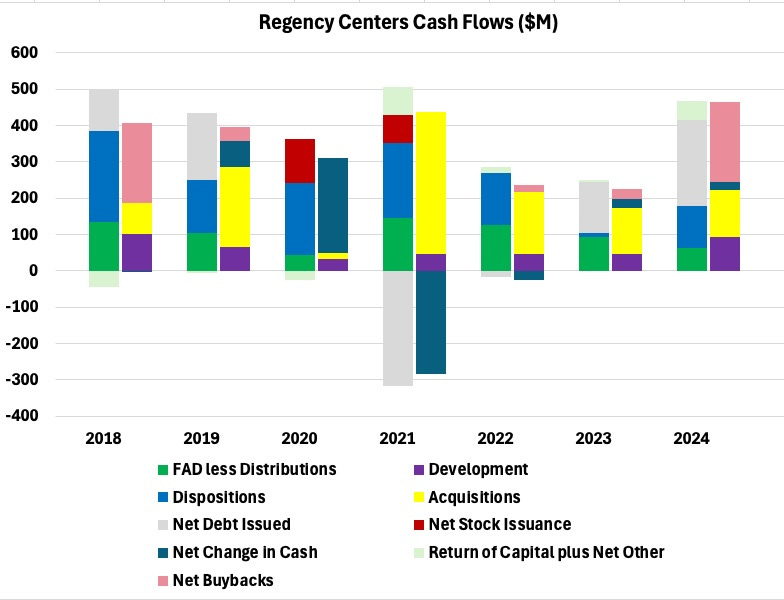
Here the left stacked bar of each pair is sources of cash while the right stacked bar is uses of cash. Averaging over the period shown, the Funds Available for Distribution (CfO less dividends less sustaining capex less capitalized interest, green) has totaled about $1.1B. These are the retained funds available to support growth.
Development (purple) has totaled about $1.5 B. These multi-year projects have been fully funded by retained earnings, which makes sense.
Dispositions (blue), at about $1B, have almost exactly equaled the acquisitions (yellow). REITs that do development often show a similar balance, with retained earnings paying for development and dispositions covering acquisitions, more or less.
Across this period, Regency has issued $300M of debt, only 20% of that development spend. They have continued to reduce Debt to Gross Assets. On net they have also bought back more than $300M of stock. This was 2% to 3% of the float, offsetting only a small fraction of stock-based compensation.
What the cash flows don’t show is the impact of mergers and acquisitions save for cash spent. In the case of Urstadt Biddle, in 2023 Regency issued $1,044M of common and preferred stock and assumed $300M of debt.
After the repurchases in 2024, the net dilution of the common over two years is 6% even as CfO rose 16%. So this was a very good deal.
Now let’s see how these actions have played out for earnings measures and look at the Regency growth model.