


Deep Dive on Regency Centers

Regency Centers (REG) has been a strong performer for nearly a decade, growing net cash per share earnings and the dividend at good rates for a REIT. We will see below that they have limited yield and limited upside, and so are not in my own portfolio.
But REG is a holding in my Go-Fishing Portfolio. It has been awhile since I took a really close look. So join me.
A Brief History of Shopping Center REITs and Regency
I spent time researching and writing about this sector several years ago, when seeking to understand REIT bankruptcies and liquidations. Some companies that are now shopping-center REITs did exist before the modern REIT era, which started in 1993 or so. Regency was one of them.
Many small shopping-center REITs listed themselves publicly in the early 1990s. They were hoping to be priced above Net Asset Value (NAV) and so to be able to issue stock to support growth.
This was not stupid. If the market expects and is willing to pay for growth, it makes sense to price a company above NAV.
At first this worked. But the markets soon lost confidence in the sector and stock prices dropped. In response, many shopping center REITs went out of existence, often through mergers but sometimes through liquidations though very rarely through formal bankruptcies.
Regency, which incorporated in 1963, dated their emergence as a “nationally based owner, operator, and developer of grocery-anchored retail shopping centers” to the late 1990s, when they made a series of strategic acquisitions [2002 10-K]. The stock price for REG (and many REITs) tripled from 2000 through 2007. But this was not mainly due to economic performance; it reflected falling interest rates.
Regency itself performed poorly economically, increasing NOI/sh by less than 10% over that period. [NOI is Net Operating Income.] Worse, they were paying out roughly 100% of Funds Available for Distribution (FAD) in dividends. A common mistake amongst young REITs, especially until a first crisis, is to pay out too large a fraction of FAD.
When FAD dropped a lot in the Great Recession, Regency found itself without the cash to pay their dividend. They also had debt maturing, with large amounts coming due in 2010-2012.
In response, Regency diluted shareholders by 26% from 2008 through 2011 to raise cash. Also, they cut the dividend by about a third and did not start to increase it until 2014.
Many REITs went through similar events across that period, responding later by lowering their Debt Ratios. Notably, though, we did not see shareholders being wiped out.
In contrast to most REITs, Federal Realty Trust (FRT) outperformed across the Great Recession. EBITDA increased throughout, Dividend coverage stayed level, and Net Debt/EBITDA stayed level. We will see later how Regency turned the tables on Federal across the pandemic.
In the years after the Great Recession, many shopping-center REITs completely restructured their property holdings, seeking to own higher-quality properties. Regency was one of them. Their limited progress at growing per-share earnings through 2017 reflected this process.
Then they and everybody faced some further bad luck. A lot of retail chains survived the Great Recession only by getting bailed out by Private Equity.
They were then listed again with too much debt, as is typical with Private Equity. After 2016, when things got slow in retail, they started going bankrupt. This continued until 2020 put the rest of them out of their misery.
The media narrative that e-commerce killed retail is so much drivel. More below on that (and in numerous previous articles). It was Private Equity that did it. I am not a fan.
Post-pandemic, Regency and other shopping center REITs are doing much better. Let’s look at some financial details for Regency.
Regency Financial Parameters
Here are some relevant earnings measures:
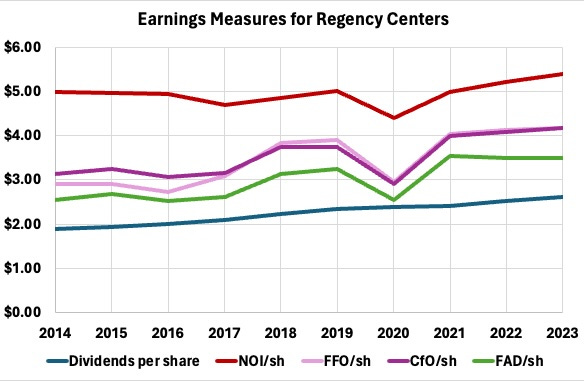
Despite the challenges of retail discussed above, the better times for REG did start in 2017. They had finished their portfolio restructuring and finished their last major merger, with a firm called EquityOne.
From then through 2023, NOI/sh grew at a 2.4% CAGR despite the pandemic. From 2021 to 2023 that was 3.9%.
You can also see that the per-share growth of Funds From Operations (FFO), Cash from Operations (CfO), and FAD is a bit more rapid than that of NOI. We will explore why below. And dividends have grown at a steady 3.8% rate.
Regency is explicit about how they intend to continue that growth. CEO Lisa Palmer said, on the Q4 2023 earnings call, “… we do target, over the long term, to grow same-property NOI by 2.5% to 3% annually. And the primary component of that is going to be contractual rent spreads and cash re-leasing spreads.” I would add that this rate will increase if there is a sustained period of higher inflation.
Overall such same-property growth should keep NOI, other parameters, and the dividend up with inflation. Earnings growth above inflation will come from development.
Regency is one of the REITs that places a major emphasis on increasing earnings via development. This exploits the systematic difference that exists between the cap rate of a stabilized property and the yield one gets by development.
We will see a bit more about that below, but the bottom line is that it should produce additional growth near 2%. That gets you total NOI growth up to 5%, give or take, before any headwinds. Pretty typical for a good REIT.
Let’s look next at some key ratios that better inform our interpretation of the earnings measures plot. Here they are:
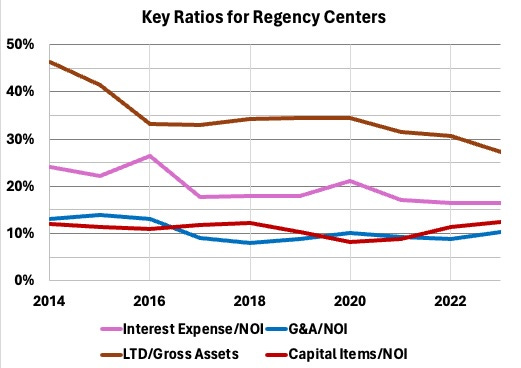
Regency aggressively pulled down their Debt Ratio, from about 60% in 2008 to the low 30s after 2016. And since then they pulled it down another 500 bps. Interest expenses as a fraction of NOI dropped from about 25% to just over 15%. This 40% decrease reflected the ~20% decrease in Debt Ratio plus a comparable decrease in average interest rate.
Going forward, the interest-rate part will likely reverse but the Debt-Ratio part won’t. Meanwhile both G&A costs and (maintenance) capital items have run about 10% of NOI each.
Overall, FAD/NOI now runs at 65%. As higher interest rates roll through the portfolio this will likely go to about 60%. Looking at the earnings plot above, this will restore the growth rate of FAD/sh to that of NOI/sh, as must be true long-term.
Dividends and Cash Retention
Next take a look at various payout ratios. I also included the ratio of FAD to CfO, which runs 85% or so.
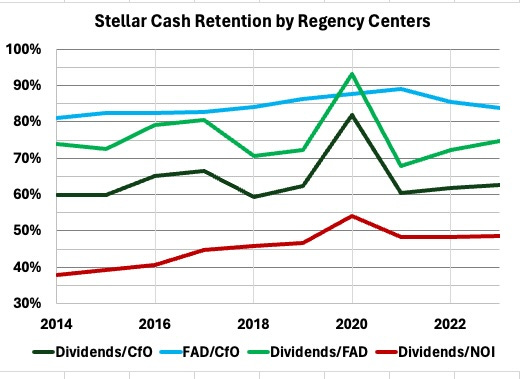
Regency skated through the pandemic without severe stress on the dividend. Natural reductions in cash invested soaked up the spike in Dividends/FAD.
You can see that dividends are now running about 50% of NOI, 60% of CfO, and 75% of FAD. This leaves Regency 25% of FAD as real cash to drive growth. More on that below, but contrast the above with what went on with Federal:
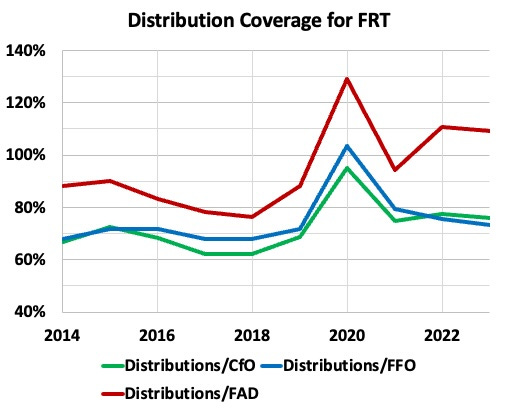
In 2019 Federal ran Distributions (they have some that are not dividends as such) at nearly 90% of FAD. Even the 20% increase in that ratio experienced by Regency would have put them well over 100%.
But Regency’s property mix is more defensive and more “essential” than that of Federal. What Federal saw was a 40% increase in Distributions/FAD to 130%.
Federal elected not to cut the dividend and took on debt in consequence. This cost them their A- credit rating. They are still not back where they were and still need to keep paying down debt.
In contrast, here is where REG stands:
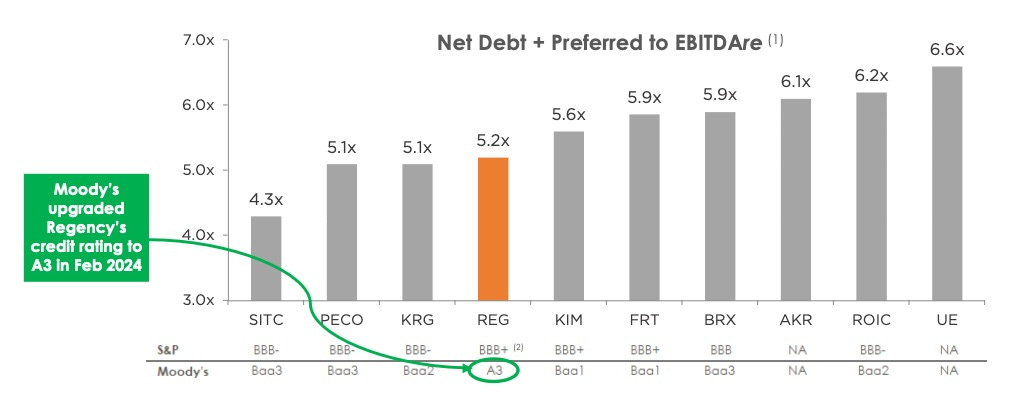
Moody’s, often more conservative for REITs, gave them an A- equivalent. S&P has them on a positive outlook and seems likely to me to follow.
The Regency Cash Flows
The best way to really see what business model(s) a REIT has been running is to look at the cash flows over time. The weakness of this view is that mergers do not necessarily stand out.
For Regency, I defined CfO as Cash from Operations from TIKR, adjusted to remove changes in working capital. The Cash from Financing items were likewise from TIKR.
But as usual TIKR provides too little detail about Cash from Investing, so I pulled that from the 10-Ks. This is the result, which we will unpack in pieces:
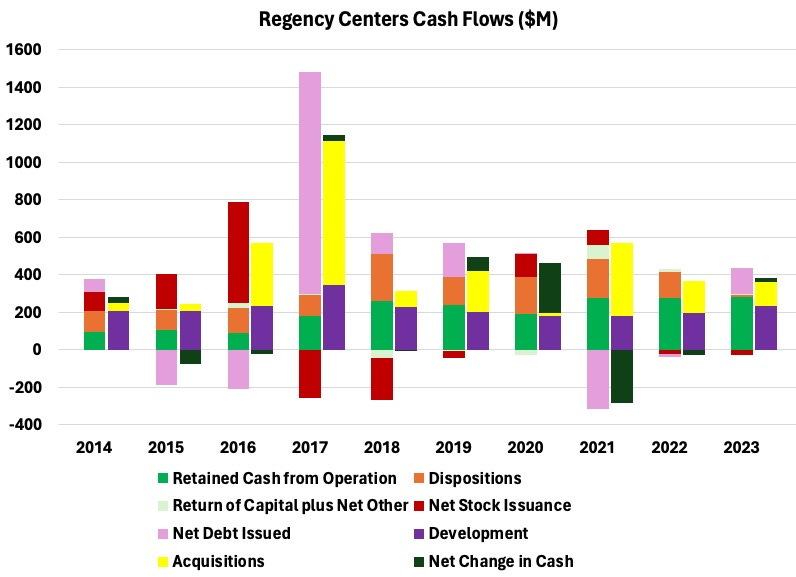
For each year there are two stacked bars. The left one shows sources of funds: retained CfO (CfO less dividends, shaded green), Dispositions (shaded orange), Net Stock Issuance (shaded red), and Net Debt Issued (shaded light purple).
You can see in the first half of the 2010s that Regency was trying to grow by issuing stock to raise cash, and can see in the above earnings measures that this did not work. There has been very little issuance to raise cash, and some buybacks, since 2016. The mergers did produce some net increase in shares outstanding, not visible here.
In contrast, after 2020 Regency has relied on retained cash, dispositions, and a bit of new debt.
The right stacked bar for each year shows uses of funds. These are almost entirely development (dark purple), acquisitions (yellow), and rarely changes in cash.
Across time you can see a steady rate of development spending. The average has been $220M per year.
The acquisitions have been much more lumpy, but also have averaged $220M/yr. Retained Cash and Dispositions have averaged $210M and $146M per year, respectively.
There is no one way to look at this, but to my mind the retained cash pays for the development, with some surplus in recent years. Then all the other shenanigans enable acquisitions.
We can note that in the past year Regency has absorbed a much smaller REIT, Urstadt Biddle (UBP), by issuing stock to pay for it. This added quality properties to the portfolio but had no notable impact on the per-share results of interest here.
[Aside: I made big gains from UBP stock across late 2020 and early 2021. The market did not realize that the exodus from New York City sent people into the NYC suburbs rather than say upstate New York. The UBP properties were in just those suburbs but they were tarred by their association with the City.]
Impacts on Growth
Here we emphasize recent years. About $200M of development at a typical yield of 8% adds $16M to NOI.
Dispositions have run near (and are guided to) $100M per year at a 5.5% cap rate. So they reduce NOI by $5.5M.
Debt levers up the NOI produced by acquisitions. Assuming they average their current 30% Debt Ratio going forward and acquire properties at a 6% cap rate, the leveraged cap rate is 8.6%. For $200M of acquisitions this implies an increase of about $17M in NOI.
In sum the total increase in NOI is about $27M. Taking the forward ratio of FAD to NOI as 60%, based on the above discussion, the increase in FAD would be $16M. This is an increase of 2.6%.
Growth and Headwinds
Adding that 2.6% to the nominal 2.5% from same-store NOI growth would give us a nominal 5% growth rate (which again will increase if sustained inflation pulls up the same-store growth rate). But this is reduced by headwinds.
The average guidance has been for a loss of 0.5% to tenant failures and the cost of retenanting. That number is higher this year.
For most REITs the big headwind today is rising interest costs. Regency is not immune but is comparatively in good shape. Here is the ladder, which is nicely stretched out:
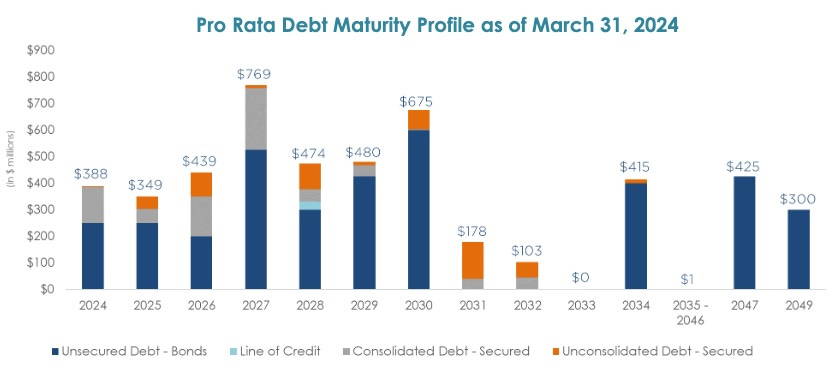
The average to be rolled is about $450M per year. The rate on existing debt is about 3.8% in near-term years. From the most recent 10-K: “On January 8, 2024, Regency priced a public offering of $400 million of senior unsecured notes due 2034, with a coupon of 5.25%.”
At that rate the new debt would cause incremental interest expenses of $6.5M. This is 1% of FAD, on the low side for REITs today, as we would expect.
On net and for near-term years, we would expect an FAD growth rate of 3.5%, give or take, depending on the combination of tenant failures and the future of interest rates. This roughly matches the historic rate of dividend growth.
Valuation and Takeaway
My view has two aspects:
Regency is in a good place to sustain growth at the rate discussed above.
Retail overall is in a good place for the next decade or more. The reset from 2017 through 2020 has put the sector overall on a sound footing.
The failure to build new retail space in the US for more than a decade has turned a surplus into a deficit in many places. This is part of why leasing demand is high for Regency and others. It will not change quickly, for many reasons.
However, the ratio today of Price to FAD for REG is about 17x. (Reminder: Price to FFO is a really dumb thing to look at.) That 17x, for example, is pricing in indefinite 4% per year growth at a 10% discount rate.
That discount rate also roughly balances the value of the cash flows within the REIT with the NAV at a 6% cap rate. My conclusion is that REG is fairly priced for current cap rates. Only if cap rates go down in response to declining interest rates will that change to the upside.
So if you want a dividend near a 4.5% yield that is likely to grow at some rate incrementally above the inflation rate, my conclusion is that REG is a good choice. I personally am not there yet, but am working to get there.
Appendix: The Idiots Somewhere on Wall Street
Taking a closer look now was prompted by some idiots somewhere on Wall Street. I confess, my research is often stimulated by something that ticks me off.
A reader posted this comment [edited for length] on an article that appeared elsewhere. It was alleged to come from Morningstar, but since I can’t confirm that, I won’t claim that Morningstar has these idiots writing reports on REITs.
The continued growth of e-commerce places significant pressure on traditional brick-and-mortar retail. While the grocery- and service-focused assets in Regency's portfolio will face significantly less pressure from e-commerce, the sales growth from this segment still won't support significant rent growth. As a result, the current rent levels and the rent increases the company achieves on its properties compared with the initial capital investment produce returns that are below weighted average cost of capital.
The continued growth of e-commerce is putting significant pressure on traditional brick-and-mortar retail. The US currently has approximately 24 square feet of retail space per capita, a ratio that is 2-10 times greater than that of other industrialized countries. As consumers change their habits from shopping in physical stores to shopping online, the demand for retail space will shrink and many existing stores and malls will go away. Approximately 25% of Regency's tenants are focused on segments like apparel, home decor, electronics, and other segments that either directly compete with the internet or require omnichannel strategies. …
While Regency's portfolio is located in trade areas that feature high average household income and high population density, its current mix competes with too many other properties in its trade areas to generate excess returns. Regency also does not benefit from a network effect moat source. Consumers prefer to make their shopping trips efficient by being able to visit their favorite stores and possibly compare prices in a single trip, making sought-after retailers next to one another a desirable location for shoppers. High-quality anchors, in line tenants, and entertainment options draw significant foot traffic to a retail, which makes placing a store in that location attractive to other retailers as their store would benefit from the large number of people already heading to the shopping center. However, most anchors and in line tenants in shopping centers are not differentiated enough to create significant draw to the property outside of the immediate trade area. …Regency's portfolio provides many highly rated tenants that are sought after by consumers, but its portfolio tenant composition isn't unique compared with other properties in the same submarkets.
We use an adjusted return on invested capital calculation to determine if a company historically has shown or is forecast to have the characteristics of an economic moat. After adjusting the ROIC calculation to use maintenance capital expenditures instead of accounting depreciation, we calculate that over the past decade, Regency Centers has averaged an adjusted ROIC approximately 110 basis points below our 7.3% WACC. While the adjusted ROIC increases over our forecast horizon for the company, the adjusted ROIC never rises above our WACC estimate.
My reaction:
On e-commerce:
I read Retail Dive every day, often the reports on retail by Placer.ai, and other coverage of retail. Morningstar is repeating the media narratives about e-commerce and those narratives are outright wrong. It has been true for years that every retailer must have an omnichannel presence. It is also true that new online brands cannot reach scale and long-term success without establishing a physical presence. Today online innovation feeds the evolution of brick and mortar stores. Plus the US has built almost no retail space for 20 years. With the exception of some urban cores, much of the country is now underbuilt for retail. Available spaces have been in very high demand for some years now.
On moats and such:
Regency does not, in my view, have a moat and they have never made that claim. They are in the business of serving the neighborhoods around their centers and not of being regional malls that draw more broadly.
Where they have tried to excel and have succeeded is at being in good neighborhoods. Their customers are well-heeled and recession-resistant. The small shop tenants are chosen to maximize recession resistance. And their grocery stores always have been.
The entire moat discussion, only some of which was included here, is just putting up a straw man and then knocking it down. It is a waste of everybody’s time.
On Returns:
These guys’ numbers about returns are lost somewhere in fantasy land. Over the past 9 years, per share FAD has grown at a 3.6% CAGR. The dividend has grown at a 3.8% CAGR, and was not cut in 2020. So their claim that REG is losing money on growth is false on its face.
If you run the numbers for acquisitions at a 6% cap rate (they do much better than that in their developments), then at their current 30% LTV their leveraged cap rate (NOI/New Equity) is 8.6%. With FAD/NOI at 60% as discussed above, the Return on Equity is 5.1% (and again higher than that for re/development.)
With their dividend yield at 4.5% (and their FAD yield at 5.8%), it would not make sense for them to issue stock to drive growth, but we saw above that they have issued almost no stock since 2016. They are growing by investing retained cash and by capital recycling.
The only circumstance WACC claims to apply to is stock-driven external growth. But these idiots are apparently too ignorant to know that. And WACC tells you nothing about growth rates even for stock-driven growth.
So however they did it, their WACC calculation does not apply to the way REG has been growing.
Conclusion: those guys at somewhere on Wall Street are NOT competent.
Please click that ♡ button. And please subscribe and share. Thanks!
Paul, your readers posted comment definitely came from Morningstar. I just read the latest company report. However, their latest stock analyst note says: " Continued occupancy gains with small-shop occupancy reaching record level."
Is REG only in shopping centers or does it also build senior communities such as Regency at Stonebrook? It is a new development about 3 miles from my home in Sparks, NV.