


Fooled again by Federal Realty, or Not?


Federal Realty Trust is showing very strong growth of rents. Are they worth buying today?
The last time I got fooled by Federal Realty Trust (FRT), a shopping-center REIT, was nearly two years ago. I saw a bullish article and thought maybe they were past some issues to be discussed below. Nope.
Lately there has been very strong news about their rent growth. Perhaps that would make FRT worth buying? This is a bit of a mystery story, as we shall see.
My most recent article on this sector covered Regency Centers (REG). Since the onset of challenging times for retail in 2017, Regency has generated the most growth of per-share Cash from Operations (CfO). REG and Brixmor (BRX) have the most price appreciation.
Here is a comparison of CfO/sh since 2017 (which leaves out a very accretive merger for REG in 2017):
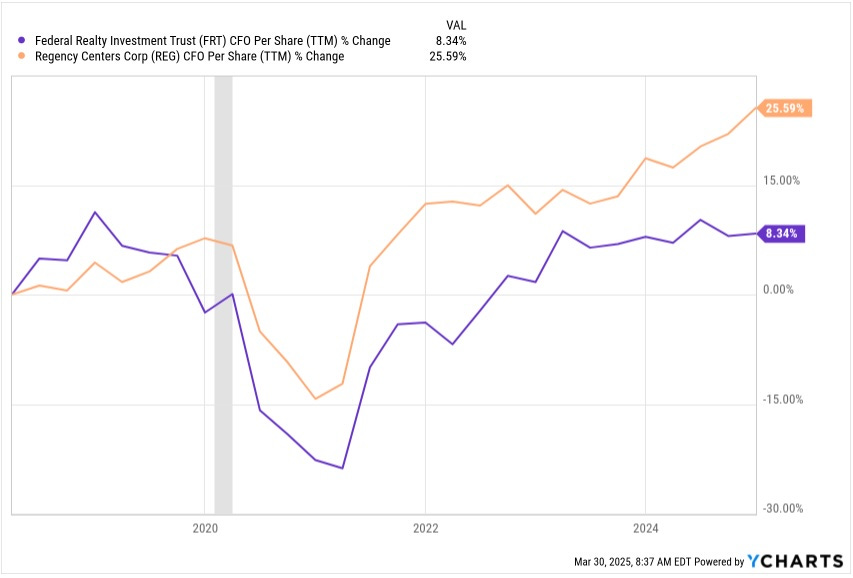
Regency has tripled the CfO/sh growth of Federal over this period. And they have doubled it since 2020.
I like Regency, own REG, and just covered their strong growth model. But for decades before the 2010s, the leader in this sector was Federal. Federal flew too close to the sun, debt-wise, across the 2010s, ending up stuck for awhile with less growth. This has been reflected in the divergence of stock prices (here shown through early April 7):
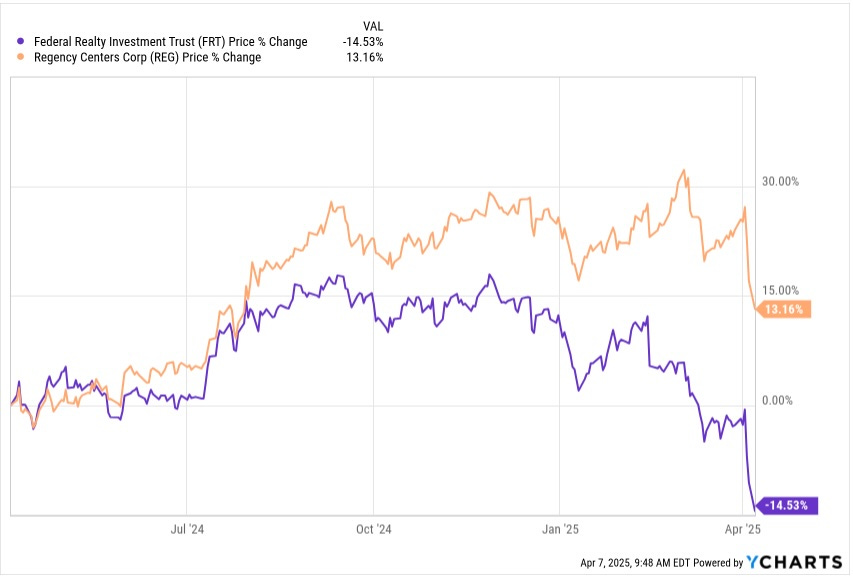
Fair enough, but that divergence has markedly increased in recent months. My first reaction was that this makes no sense, considering the absence of big news about either company. So maybe one should now buy FRT.
We see here that the difference has reflected a recent change of valuation (i.e., earnings multiple or P/CfO, through early April 7):
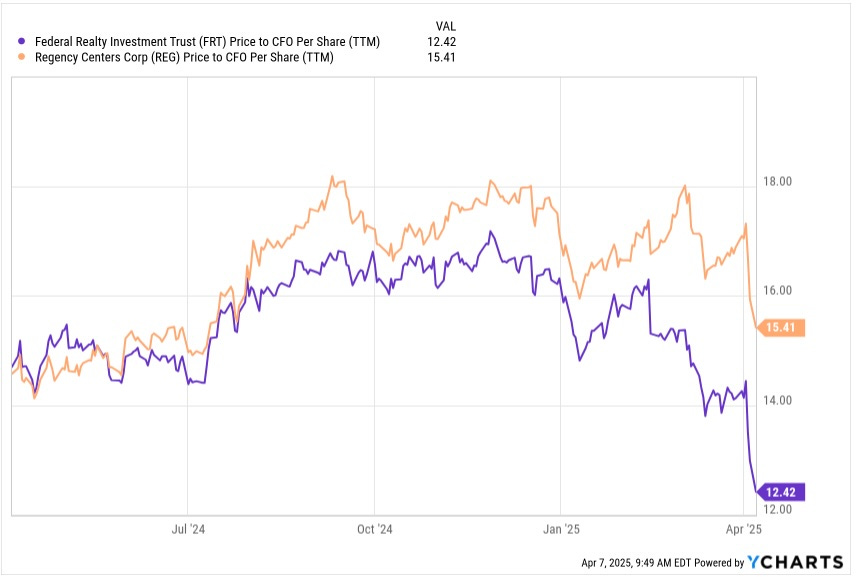
The multiples were the same a year ago but the multiple for FRT has dropped strongly and is now 3 turns below that for REG. Again, based on past work this strikes me as too much.
So perhaps Federal, very much a quality operation, will see FRT outperform the sector (and REG) over the next years or decade. If they are primed to grow bottom-line cash earnings, this is plausible. And even without that, their valuation today seems too low.
But maybe I missed something. Let’s look.
Federal at the Moment
Federal provides a nice overview in their investor presentation. Here a brief summary of their attributes:
BBB+ credit rating and well-laddered debt
Properties located in “first-ring” suburbs
Well-diversified revenue stream, by sector and by company
Very low exposure to bankrupt tenants
Sector-leading demographics
Average household income (3-mile radius) above $100k
2,500 households per square mile, 50% more than any other such REIT
An increasing emphasis on mixed-use properties, incorporating retail, residential, & office
A Dividend King, with the longest history of dividend increases amongst REITs
They love to brag about their dividend track record, and who can blame them:
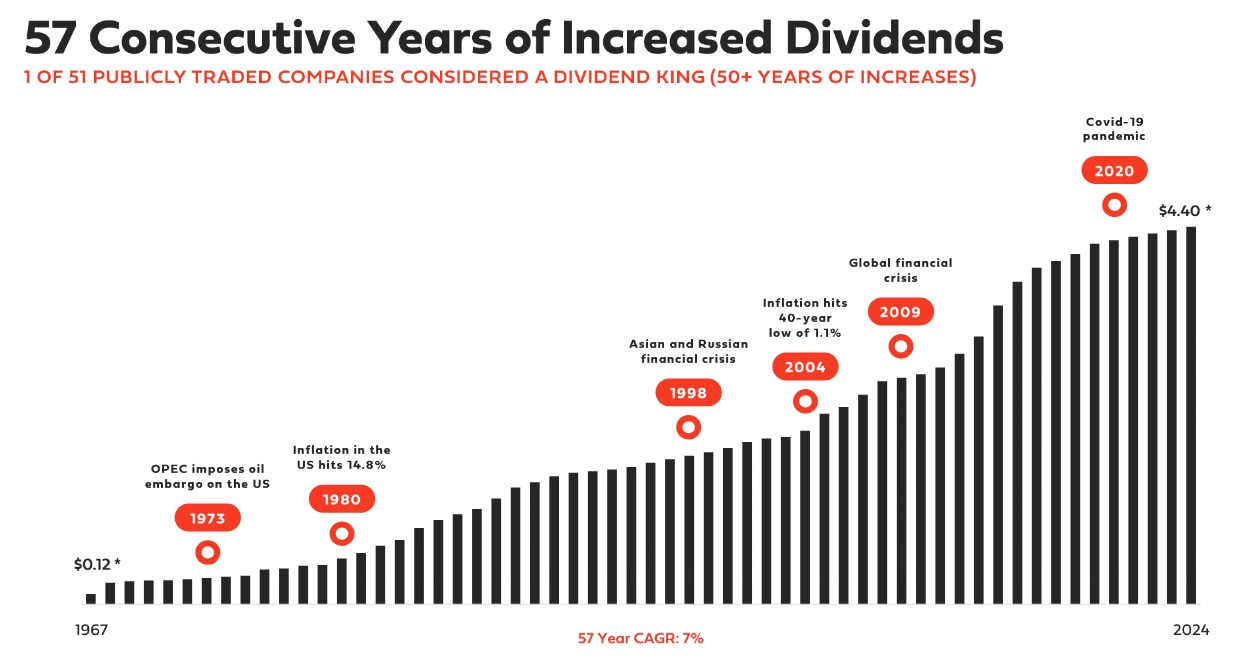
That long-term 7% CAGR is what they emphasize. But what stands out to me is that there have been brief periods of strong increases with much slower growth in between. More on that later.
Federal is riding high today because demand for their retail spaces is very high. (See more discussion of this in my Regency Centers article.) In recent years this has enabled Federal to get escalators on their rents of 2.5% or more, which they love to brag about.
Thanks to “record-breaking” leasing volumes, their occupancy has increased to near a 20-year high. Let’s look at the resulting growth of earnings measures:
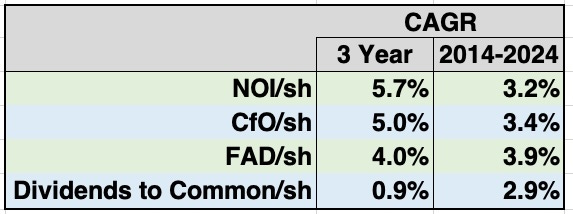
Over the past three years the CAGR of NOI/sh has been 5.7% and that of CfO/sh has been 5%. 2025 guidance is for 5.8% growth of FFO/sh.
[FFO — Funds From Operations — is a GAAP-derived number that often fails miserably to display actual cash generated by operations. In this case, it is close to reality with FFO for Federal being consistently near CfO.]
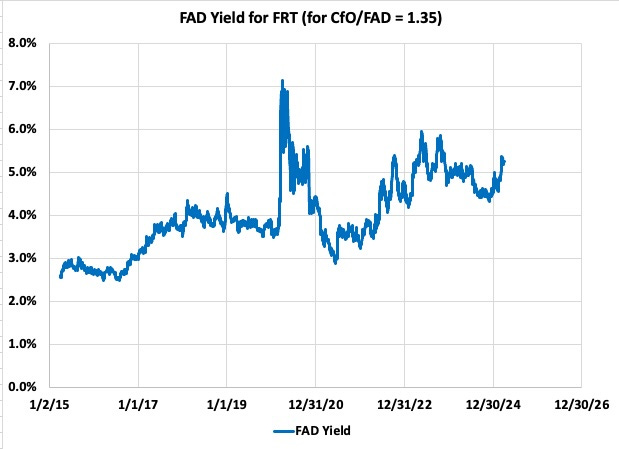
However, CfO and FFO do not measure actual cash earnings that might cover distributions. For that you need FAD — Funds Available for Distribution. FAD is found by subtracting sustaining capex and capitalized interest from CfO, with CfO adjusted to remove changes in working capital.
[I interpret the numbers they give for leasing expenses plus for “capital expenditures — other” from their 10-K as the sustaining capex. Explanations are absent and there has been no response to my email inquiry from April 2.]
FAD has a 3 year CAGR of only 4%, close to its longer-term average. The reason FAD did not grow with CfO is that the sustaining capex has substantially increased, with a 3-year average total that runs 150% of its average over the previous 8 years.
Just as I discussed regarding Orion Properties (ONL), the increased sustaining capex is driven by increased leasing and can go on for years. You can see here that for Federal it has been taking about two years to get newly leased properties occupied (which is when rent payments begin):
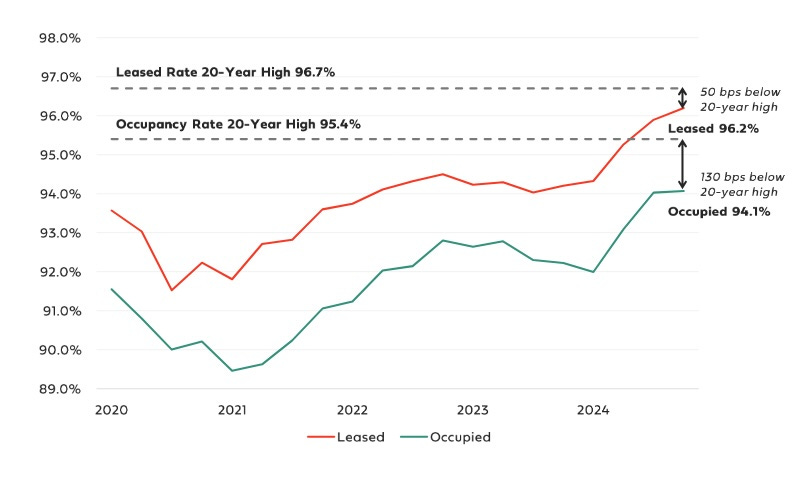
While the rate of growth of leasing will slow within a year or two, we are still looking at several years of significant sustaining capex to support the growth. That said, the sustaining capex is unlikely to grow beyond where it is now. So I expect that FAD/sh will begin to grow more strongly.
On top of all that, stronger rent growth from increasing occupancy and high demand might last awhile but will not last forever. We look at drivers for growth below.
The fly in the ointment here is the lack of growth of the dividend. The 3-year CAGR is 0.9%. But if the dividend grows much less than FAD, what good is this stock to income-hungry retirees amidst inflation? So why is a REIT growing FAD/sh at 4% growing the dividend at less than 1%, and will this change?
We address these questions below.
Dividends, Distributions, Decisions
Federal pays the dividend shown above on Common Stock. Their total distributions are larger because they also have preferred dividends and some net distributions to “noncontrolling interests.”
The common comparative ratio discussed is of dividends to FFO, which is sort of stupid in several ways. What is more relevant is the ratio of total distributions to FAD.
Here is that ratio, and a couple others, over the past decade:
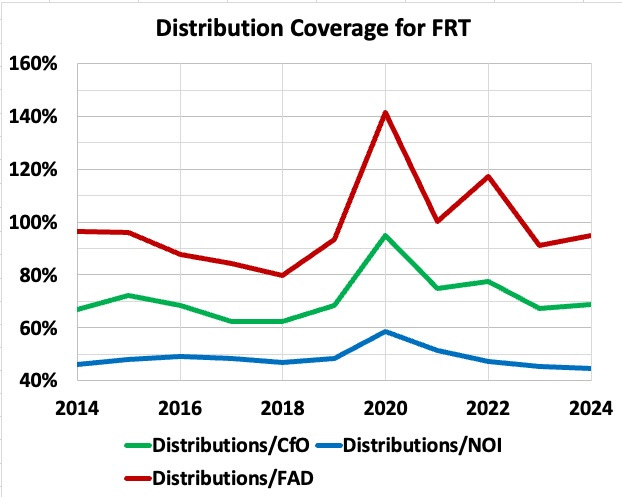
Federal has paid out about half of NOI and 70% of CfO (and FFO), a level often described as “safe”. And 70% is safe for a net-lease REIT holding retail properties on triple-net leases.
But look at the ratio of distributions to FAD. This has been near or above 100% more often than not over the past decade. Only in 2018 did it come down to a more reasonable 80%.
Any REIT with that ratio well above 140%, as happened in 2020 to Federal, would be well-advised to cut their dividend. Federal decided instead to sustain their distributions by adding debt, in order to retain their Dividend King status.
This is why the dividend has gone nowhere for 4 years. And it will keep going nowhere until they can pull FAD up above the distributions, unless they become more foolish.
If they are not foolish, they will keep slow-walking the dividend and let this current era of rapid revenue growth improve the distribution ratio. If the growth of FAD/sh comes up to the 6% we are seeing in CfO/sh, that will take about 4 more years.
How to Misuse a Good Balance Sheet
We just saw how Federal set themselves up for their current inability to grow the dividend. They paid out too large a fraction of FAD.
But there is another aspect that made things worse. Debt.
Federal ran though the mid-teens with interest expenses at 25% to 30% of NOI. In contrast, Regency ran below 20% after 2016. That does not sound like a big difference, but in the event, without cutting the dividend, Regency’s ratio of dividends to FAD peaked at 93% in 2020.
Here is where that came from:

Some commentators seem to ignore debt as just going along for the ride. But in fact low debt is critical to being able to sustain the dividend and avoid dilution during tough times.
So How Did They Grow?
With all this negative perspective, it seems remarkable that Federal was able to sustain their long-term growth. A significant element is rent increases.
These drive an increase in same-property NOI, which is nearly all of their NOI, of 3% to 3.5% per year. If G&A, interest costs, sustaining capex, and capitalized interest were not growing, this would produce growth in FAD/sh of 6% to 7%.
Now those other costs do grow, but still the observed FAD/sh growth near 4% might be entirely due to the rent bumps. So how did they avoid producing much per-share growth beyond that?
To explore that we look at cash flows:
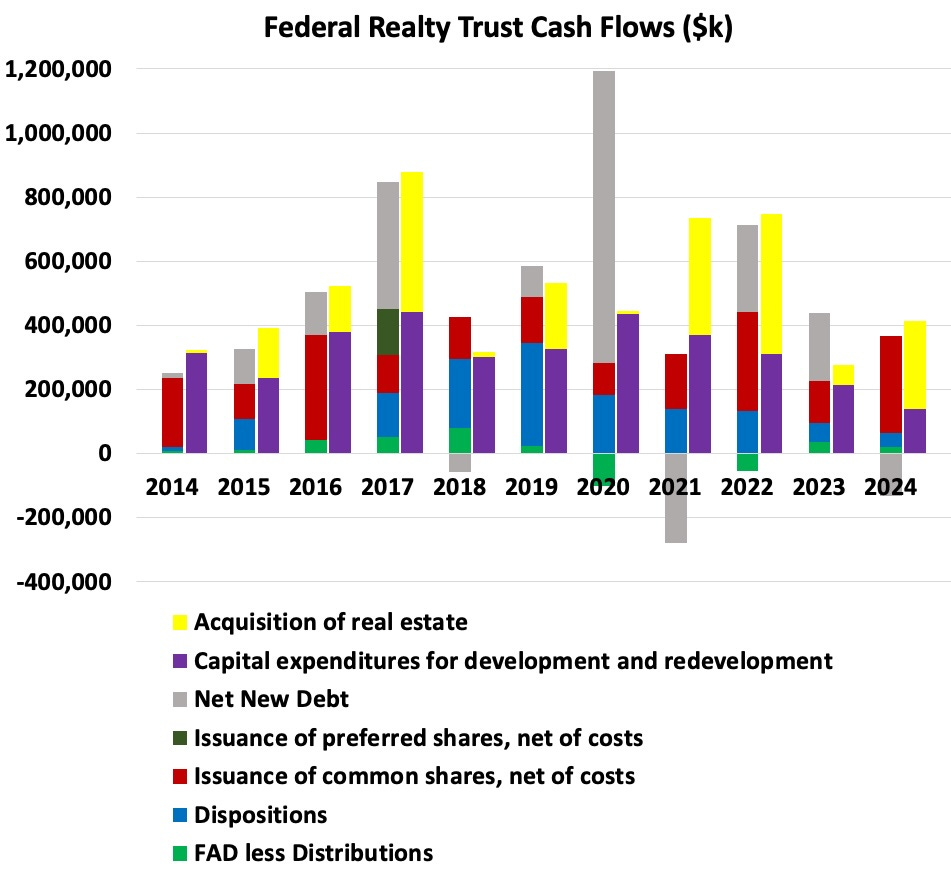
Here, for each year, sources of cash are the left stacked bar and uses of cash are the right stacked bar. What jumps out at me here is how much purple there is on this plot. Federal is deeply devoted to development.
However, in contrast to Regency, Federal has near zero retained cash earnings (green). Regency uses those retained earnings to pay for their development, which is prudent since the markets for dispositions (blue) and for issued stock (red) can quickly move against you. Federal needs both to cover their development and redevelopment activity.
This is just very aggressive, and so is prone to fall short of anticipated growth. Let’s look at the numbers.
Recycling capital, via dispositions, is not a big financial winner (although there are strong reasons to do it). Recycling $200M at a 100 bps spread adds $2M to NOI (a quarter percent) and about twice that fraction to FAD. In round numbers, a half a percent.
Funds raised by issuing stock were 3/2 of the proceeds from dispositions. But this too does not produce much FAD/sh growth, because issuing that stock first dilutes the FAD/sh, after which the new properties are supposed to grow it further.
The first key question when issuing stock is that the FAD yield is. Here is an estimate:
In 2024 they issued $300M of stock, which is 3.6% dilution. The implication was that they needed to increase FAD by $15M to keep FAD/sh constant.
In other words, they need an ROE for that $300M of 5% to break even, ignoring costs. And really they need more because there are costs. For their numbers, the ROE is 6.7% for a cash yield of 7.5%, the midpoint of their current 7% to 8% target range (for either acquisitions or developments).
Then with 3.6% dilution this grows FAD/sh by 1%. [Apologies for not yet doing a nice, clean Substack post about how this calculation works. That will come.]
The bottom line for us today is that all those shenanigans with growing the assets only adds less than 150 bps to the impact of rent growth. So one might see FAD/sh growth of 8%/year, were there no cost increases. But costs do increase.
The big cost increase recently has been interest expense, and that will stay true unless interest rates drop significantly. Here is the FRT Debt Ladder:
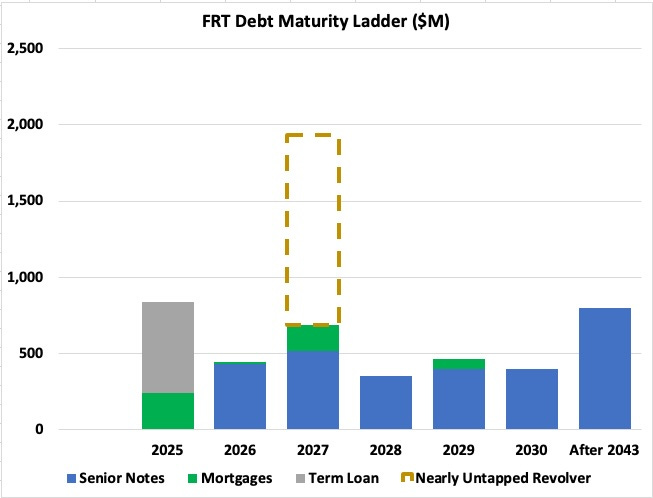
They need to refinance or replace about $400M per year. At the current 150 bps difference between their weighted average interest rate and current rates for BBB+ corporate bonds, this will increase interest expenses about $6M per year. And this in turn will be a 150 bps headwind to FAD/sh growth.
The big question going forward, though, is what will happen to the sustaining capex plus capitalized interest expenses. These were a whopping 40% of FAD in 2024. If those costs went back to their average from the 2010s, it would boost FAD by more than 10%.
That would let Federal grow the dividend and/or gradually reduce debt. But from the above, that decrease in sustaining capex looks to be 3 to 4 years in the future.
Looking Ahead
Federal has pulled their Debt Ratio down from 41% in 2021 to 37% today. Key to growing their dividend without having to add debt is to get it down further. It is very unclear what they will do on this issue.
In the past three years, they have been driving rents up rapidly (about 26%), but also have seen sustaining capex jump even more (about 50%). Over the next three years, rents may well increase another 26% but sustaining capex is likely to be more or less flat. This would push FAD/sh up by more than 20%, enabling some of the progress discussed above.
My opinion of the pattern of cash flows seen above is negative. It is seems to risky to me. But perhaps they will get away with it.
The above discussion is very focused, perhaps too focused, on growth. Overall, Federal is rock solid financially and has been dedicated to sustaining their dividend.
In addition, this period of high demand for retail will improve their cash earnings in the long run. And better dividend increases are likely to come as occupancy stabilizes.
Should You Buy?
As a source of enduring dividend income, likely to grow but not with inflation for a while, FRT is a decent choice. And any dividend cut is likely to be limited.
That is, unless a severe enough recession significantly reduces occupancy and revenues. Then Federal could end up with hard choices about the dividend. But they are located amidst the people who tend to suffer little during recessions, so maybe that would not happen.
Whatever the hard choices turn out to be, Regency is likely to face easier ones. They also serve a similar group of people.
At this moment, the dividend for REG is 4.2% while for FRT it is 5.1%. Probably a fair difference.
As a source of upside, the case for FRT is weaker. Until they do improve their Debt Ratio and payout ratio, Federal will remain at risk compared to Regency. They will also grow more slowly.
That three turn difference in valuation does still seem large, but there should be a discount from REG to FRT. If that discount were to drop in half, then the price of FRT would rise about 10%. Not enough to write home about.
So if you are buying FRT for upside, you are looking for the market to recognize the future growth in FAD/sh that is clearly coming. Or you are looking for declining interest rates to raise all boats. Could happen, might not.
Please click that ♡ button. And please subscribe, restack, and share. Thanks!
Great article, Paul! Please forgive the ignorant question, but what do they use the capex for? Is it mostly development of new shopping centers or improvements on existing assets?
Are tenant improvements in this bucket? If so, what's the weighted average lease expiration looking like, and do they disclose average TI spend?
Calmly considered,clearly presented,thorough quality. Once again.
In a world full of hyperbole, there is too little of this level of wisdom and quality around us nowadays.