


REITs: Structure of Growth

Humble pie has been on my plate a lot over the past five years. This is not about investment losses, of which I have few especially lately (detailed in my year-end articles).
But my goal is to invest based on fundamentals, and learning of details of REIT growth has been a bumpy road. Let me share some of this hard-won knowledge with you.
Deeply ignorant REIT investors focus on Net Income and EPS. We won’t discuss them further.
Meaningful analysis of REIT earnings and their growth starts with cash Net Operating Income. This is cash revenues less property operating expenses. From there things proceed schematically as shown here.

Start With NOI
NOI is the starting point. In the long run, what happens to it determines total return. Here is the recent history of NOI/sh for four REITs that I have recently analyzed:
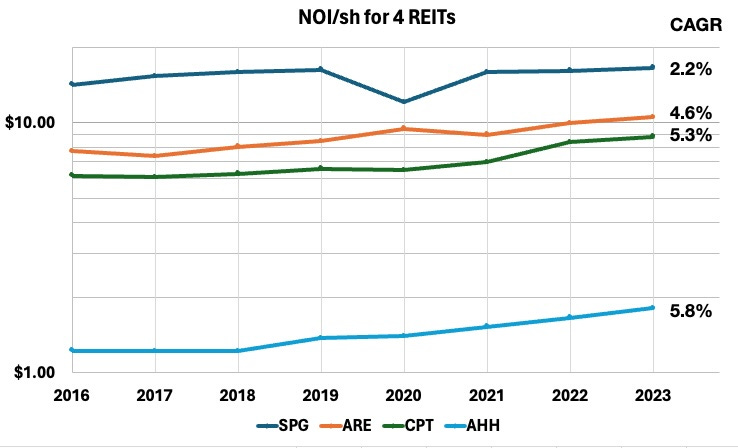
For three of these REITs, GAAP is not very distorting of cash revenues and the GAAP numbers are shown here. But for Alexandria Real Estate (ARE), the plot shows cash basis NOI, which takes extra work to compile.
Growth rates near 5% are very solid for REITs. Three of these REITs have done that.
My recent article on Simon details how their long term growth rates of NOI/sh, since 2002, have run just below 3%. The last seven years has been worse than that, but the years from 2013 through 2016 produced powerful growth.
Moving down the flow chart above, all the other earnings measures involve subtracting various things from NOI. These may vary with time, either fluctuating or exhibiting longer-term, secular or structural trends. An example of the latter is Camden Property Trust (CPT), discussed further below.
Now Get to CfO and FFO
The key costs subtracted from cash NOI to get to Funds From Operations or FFO and Cash from Operations or CfO are General & Administrative (“G&A”) costs and interest costs (shown in red on the flow chart). In the absence of GAAP distortions, FFO and CfO should be nearly the same.
The mandated processes used to calculate each of these are different and also more complex. In both cases, though, they start with GAAP Net Income.
The calculation of CfO takes out all the non-cash elements included in Net Income. In my view it is the best, easily-obtained parameter for estimating REIT earnings. [Even better is to adjust CfO to take out changes in working capital, which fluctuate wildly but average to zero.]
The calculation of FFO, a measure defined by a political process, takes out primarily Depreciation & Amortization, gains or losses on sale of properties, and non-cash impairments. It leaves in a lot of other GAAP distortions.
Alexandria is an example of how bad this can be. Here are various earnings measures for them, some discussed further below.
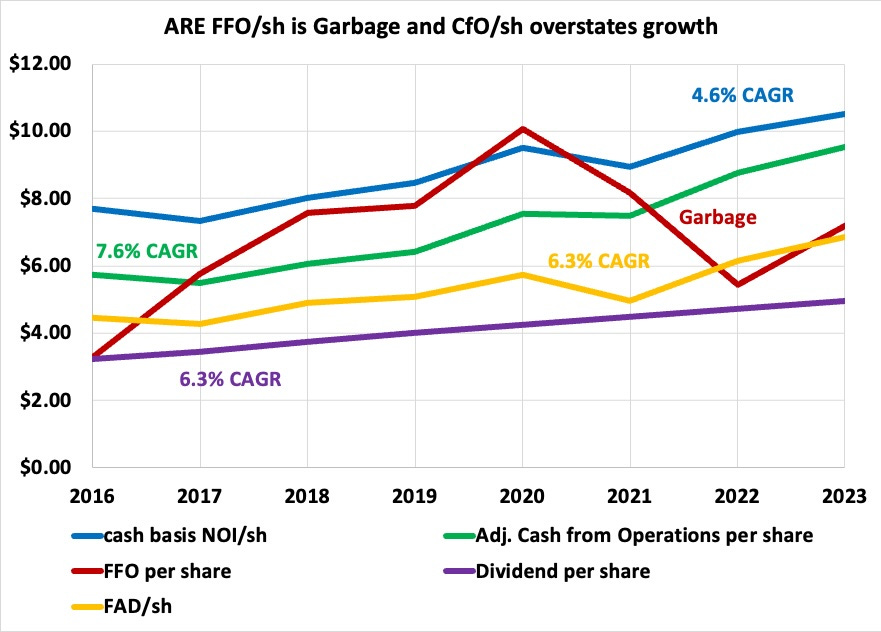
You saw the same blue curve for NOI/sh in the previous plot, and you can see the green curve showing CfO/sh below it. The green curve shows a higher growth CAGR than the blue one, reflecting a decrease in the interest expenses charged against revenues. But see below; the actual increase in the ability to grow dividends is smaller than the green curve makes it seem.
But of course your eye is drawn to the red curve, showing FFO/sh. It bounces around all over the place, ranging from more than NOI/sh to less than half of NOI/sh.
This curve clearly has no possible relation to actual cash earnings. Yet most articles on Alexandria talk about FFO as though it means something. It does not.
The problem here is the aspect of GAAP that Warren Buffet complained about in his recent annual letter. One is required to report, as current income, the changes in unrealized gains and losses on investments.
It is common to arrive at an Adjusted FFO that is supposed to better represent cash earnings. One can take out recurring capex (and add back stock-based compensation), along with with other items correcting for GAAP. But this is not standardized and some REITs provide their own versions more favorable to themselves.
Finding FAD
There is one more wrinkle that is usually small. One must further subtract capitalized interest to get to FAD, or Funds Available for Distribution.
Capitalized interest, the conversion of construction financing costs to capital, is usually small. But I recently learned the hard way that it is not small for Alexandria.
Usually one would note that the purple curve above is always below 2/3 of CfO/sh and sometimes quite a bit less, and infer two things. One would be that the dividends from that REIT are very safe. The second would be that the REIT is generating solid funds to support internal growth.
However, in the case of Alexandria, that capitalized interest has recently increased to above 20% of CfO. As a result, FAD/sh has grown more slowly than CfO/sh, an unusual occurrence.
But still FAD/sh grows faster than NOI/sh. This cannot continue indefinitely. Growth of FAD/sh will slow eventually.
And it is not directly on the flow chart, but the dividend will be some fraction of FAD, except for brief exceptional periods. The dividend on ARE (purple curve) has been running near 80% of FAD. It is no surprise that it has been growing at about the rate that FAD has.
That 80% payout ratio on FAD is not uncommon but also neither super safe nor powerful for driving growth via retained earnings. And unless it is suppressed for some reason, the dividend can only grow as fast as FAD does.
What Produces Trends?
So with all that background, look again at the flow chart.
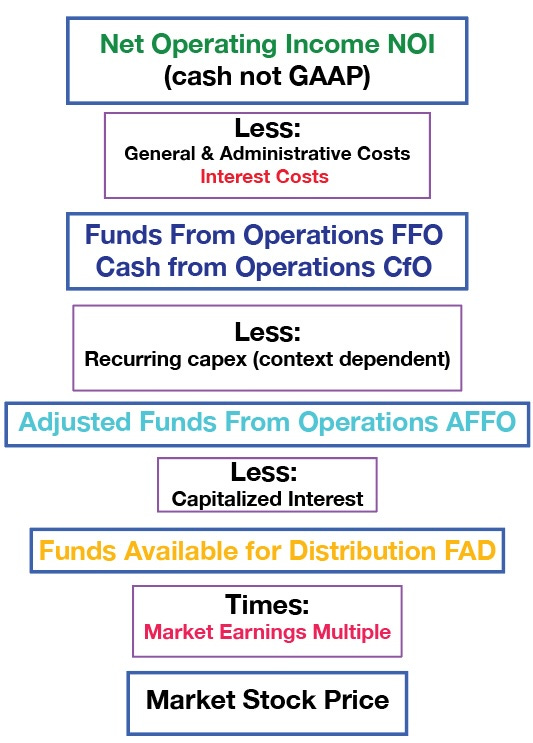
Every step here has its mousetraps but still one can find one’s way to FAD. And then the market pricing of the stock corresponds to some earnings multiple.
A great deal of the focus in the REIT articles is on P/FFO. I hope you can see that this can be quite dumb. It’s just easy, is all. [The exception is the Net Lease REITs where GAAP has much less ability to screw things up.]
In the flow chart four quantities are subtracted from NOI along the path to FAD. And then the fifth quantity multiplies FAD to get a stock price.
Only two of these five quantities vary secularly over long periods. These are interest costs, through the variation in interest rates and leverage, and earnings multiples, through variations in stock prices.
Interest Rates
Ten-year interest rates dropped a factor of more than five from the early 1980s to the ZIRP era. Earnings multiples have varied a factor of more than four across the past century.
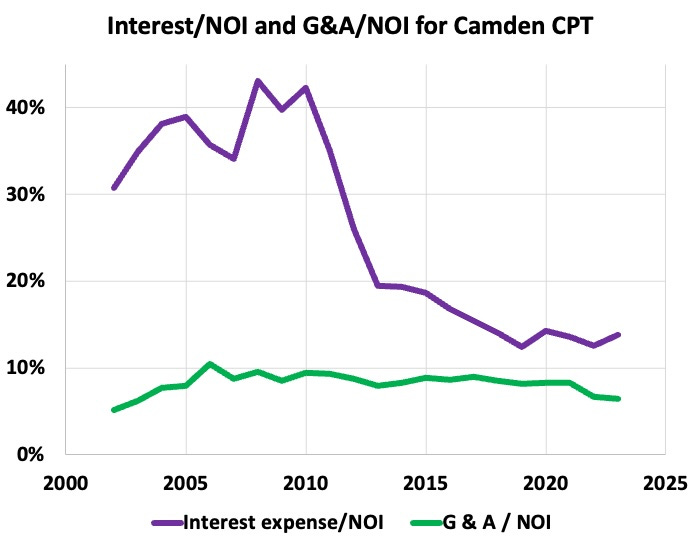
Leverage can matter too. Here are interest expenses and G&A costs as fractions of NOI for Camden Property Trust (CPT), from my recent article.
For Camden, interest costs, as a fraction of NOI, dropped a factor of three from 2010 to 2020. There were two contributors.
The fast effect was that Camden diluted shareholders to lower their ratio of Debt to Gross Property from about 60% to 30%. They needed to; details are discussed in my recent article on them.
A lot of REITs did similar things once the Great Recession showed them that they were in fact swimming nearly naked.
The second contribution was reduced interest rates, as the 10-year Treasury rate dropped about a factor of two across that decade. But the impact of such changes on REITs is not immediate, as it takes some years for their debt to all roll.
Circling back around to FAD, the next table shows the impact. Assumptions:
Keep cap rates at 6% for modeling.
Set other costs at 20% of NOI, a not atypical fraction for REITs.
Consider how the ratio of cash earnings to NOI for new investments varies with interest rates, for selected values of that Debt Ratio.
Here is what you get:
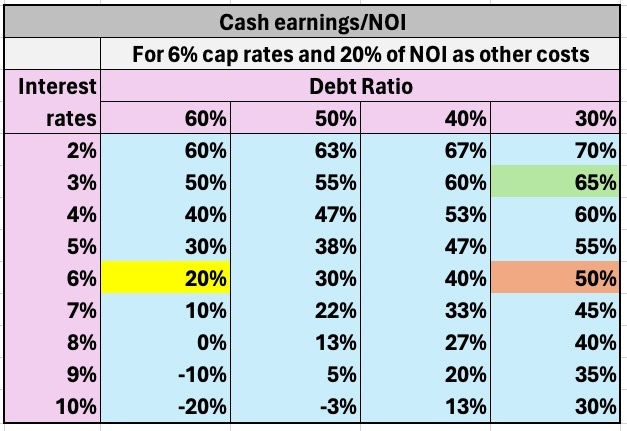
The cell shaded yellow shows about where Camden was in 2010, with Cash Earnings only around 20% of NOI. The Debt Ratio was 60% and their interest rates were pushing 6%. The problem here was this: at that level bad times can quickly reduce NOI enough to wipe out cash earnings.
The green cell shows where they went by 2021. Cash Earnings/NOI for new investments more than tripled. But you can see that most of the change was due to changing Debt Ratio.
Since 2021, as rates have pushed up near 6%, Cash Earnings/NOI has dropped by to about 50% (the tan cell). And the ratio may well increase from here, assuming rates ease.
The point is that yes, structural changes in Debt Ratio can have a big impact on FAD/sh. But the big changes across the Great Recession seem likely to me to endure.
Inflationary times do enable higher leverage to produce more growth. But my view is that the blue-chip public REITs are more likely to stay cautious and leave some gains on the table, protecting their shareholders.
In contrast, interest rates will fluctuate. Over time they have ranged about a factor of five. For a 30% Debt Ratio, it takes an increase of interest rates from 2% to 9% to drop Cash Earning/NOI by a factor of two.
In contrast, under the same assumptions and for a 60% Debt Ratio, such a change in interest rates turns Cash Earnings negative.
Earnings Multiples
We do not have lots of decades of history on REIT pricing. Also, what we do have is data on the ratio of Price to FFO, a flawed measure as discussed above, for a period of just over 20 years.
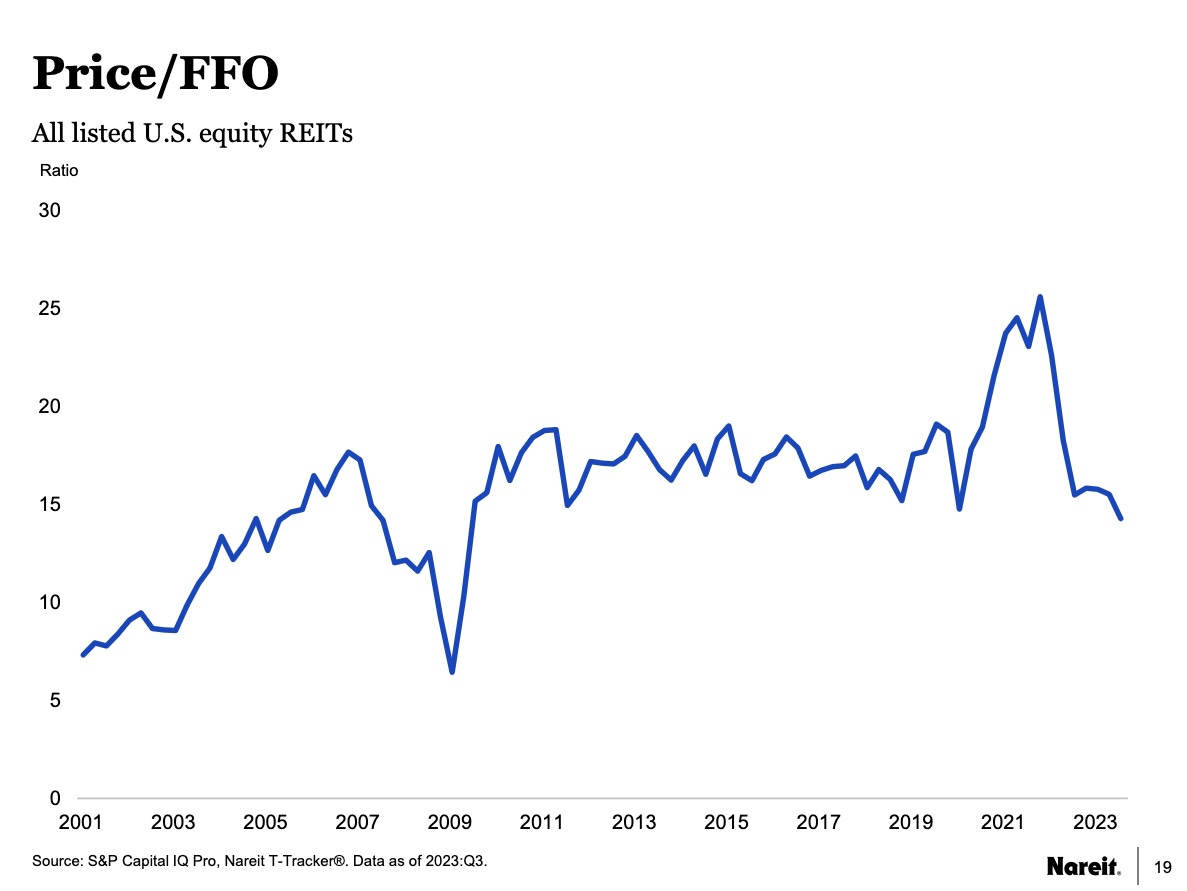
There was a huge dip in 2020 for many REIT categories, but not for some of the REITs with the largest market caps. So that is not prominent on this plot.
Also the dip in 2009 is overly deep because at that time impairments were subtracted from FFO. There were a lot of those in 2009.
But overall you see a factor of 4 change in P/FFO across time here. REITs active in 2001-2002 got more than a doubling of earnings multiples within 5 years. Then in 2021 they nearly doubled again, but that did not last.
Three points are worth making. First, secular trends in earnings multiples can produce CAGRs of pricing of several percent or more. Second, all REIT history has lain within the 40-year period of declining interest rates and the past few years. We have no history from an extended period of increasing interest rates.
Third, there is absolutely no reason to assume that any of this recent history represents a “normal” toward which the market will return. And there are many reasons to think that the Fed-driven asset appreciation of the 2010s is unlikely to repeat. Despite this, a large fraction of REIT analyses that I read make this sort of assumption.
Life is more uncertain than that and could turn out worse. This underlies my personal emphasis of dividends over total return.
Although the phasing is different, you also see large variations in traditional PE ratios for the S&P 500.
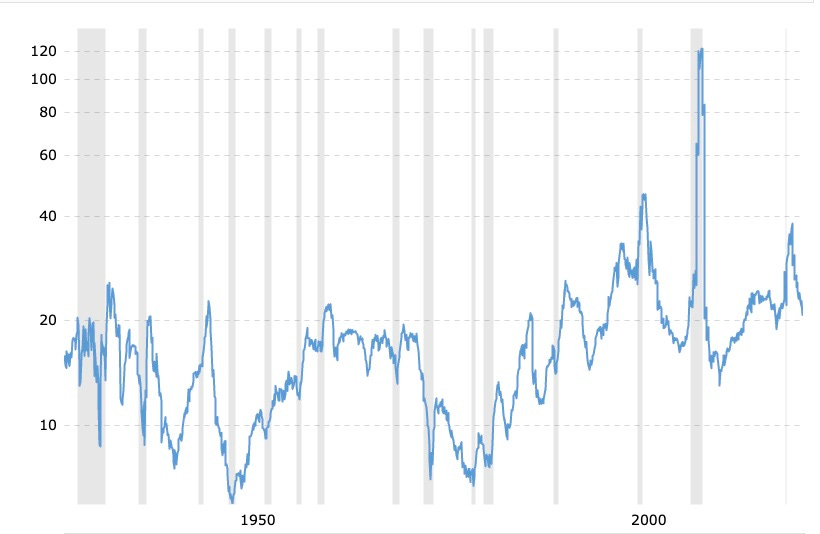
Leaving aside the spike during the 2009 crash, these have also varied a factor of four over time. Still, it is too early to say whether one will see that level of decorrelation long-term.
Where are we Now?
Here is how this adds up in my eyes. There are four things to look at for a first perspective on returns from a specific REIT.
Is the dividend secure within reason? This requires looking deeper than FFO payout ratio.
What is the growth rate of cash NOI/share? This requires removing GAAP distortions if they are large.
How might their interest rate change and with what consequences? This requires looking at the structure of their debt.
What is the exposure to economic changes in their sector? This requires knowledge and quality thinking.
On an extremely long timescale, REIT price returns should match the growth of NOI/sh. Solid REITs often have NOI/sh growth near 5%.
But on shorter timescales, even 20 years or more, price returns may deviate from the rate of NOI/sh growth. This century has seen upward deviations. That is not guaranteed and the reverse is possible.
Secular trends in interest rates will be one significant source of such deviation. Interest rate movements of only a few hundred bps per decade can add or subtract a few hundred bps to those returns. Or more for higher Debt Ratios.
In the worst case, higher interest rates can wipe out the gains. We’ve seen the growth wiped out in some cases here lately. (Of course the sword cuts both ways and large additions to growth are also possible when rates decrease.)
The second source of deviation of price returns from NOI/sh growth will be changes in market earnings multiples. Anybody who gives you “normal” values for these is blowing smoke and may not know it. And these changes can have impacts comparable in size to those of interest rates.
This adds up to a spectrum of possibilities:
Best case: multiples and interest rates both move favorably and add more than 500 bps to intermediate term price growth rates. This produced the price CAGRs near 10% seen for some REITs in this century.
Middle cases: multiples and interest rates move in opposite directions or don’t move, so price growth rates will follow NOI/sh rates and end up at a few percent.
Worst case: multiples and interest rates move unfavorably on net and you see real prices as flat or declining, reflecting declining market valuation of roughly flat earnings.
The future is never predictable. But there are times when your guesses are more likely to be right, since some trends are well established and seem to have room to run.
The present moment seems to me NOT to be one of those times. Any of the above could happen for awhile. Longer-term, though, the less-positive options seem more likely to me.
The Fed seems unlikely to keep doing things that push up asset values, and may not have the means anyway. Going back to ZIRP seems unlikely and pushing to negative interest rates seems even more unlikely.
I agree with Lyn Alden that the next decade will probably be quite volatile. And it seems to me that earnings multiples will reflect this.
In short, the good times are (probably) over and we do not know how bad it will get, or for how long, or whether it is starting now or may wait a year.
What is the Point?
The point here is to ground your plans and expectations in reality. Any investment for upside can get torpedoed if the markets make a secular move in opposition to your hopes.
An example for me at the moment is CPT. I am invested on the grounds that CPT is undervalued compared to other blue-chip multifamily REITs.
I hope that undervaluation will close via an upward move of CPT. But it also could close via a downward move of everything else. Capital gains are not guaranteed, though capital losses would be limited.
Between CPT and Alexandria Real Estate (ARE), I have 7% of my portfolio exposed to that kind of possibility. That exposure is an acceptable risk for me, especially with current, well-covered dividends yielding above 4%.
So be wary of authors and analysts predicting nothing but sunny weather. And tend to your portfolio and plans so that you can survive the storms.
GOLD standard in quality ! Thank you for such an insightful article. So much better than fist pounding buy, the more it drops the more I buy type articles. Just this article is worth more than the subscription value for the year !
At small banks for RE loans we worked off NOI. It was simple. For corp entities its vital to understand machinations and seasonality of working capital accounts (often clues to business health) before you eliminate variations in WC (yr/yr . qtr/qtr) from your CF analysis. This is often not done in the analysis I see of cash flow. Re-ocurring CF is what matters (less capx) . I have struggled with the "other" line item entries on public companies statements if material or re-occuring. Never gave ounce of thought to capitalized interest for REITs until you brought it up for ARE... Are their any other REITS in your purview this is a material number for (perhaps change in AFFO more than 5%?? ) Thanks.