


Camden Property Trust: Finding Welcome Upside

This article is a next step in my annual trip through my holdings. Some readers tell me they hold their breath when I write on stocks they hold. Well, I may scare you a bit today but keep breathing; it turns out well.
Camden Property Trust (CPT) is one of the big, blue-chip multifamily REITs. They develop, acquire, operate, and sell apartment communities. They have also begun to dabble in single-family residential homes.

Focused on the sun belt, Camden saw great rent growth after the pandemic. They now face an excess of supply in their markets, which will transform to a deficit within two years.
My view of the market price of CPT has varied strongly in recent years. No wonder; see here:
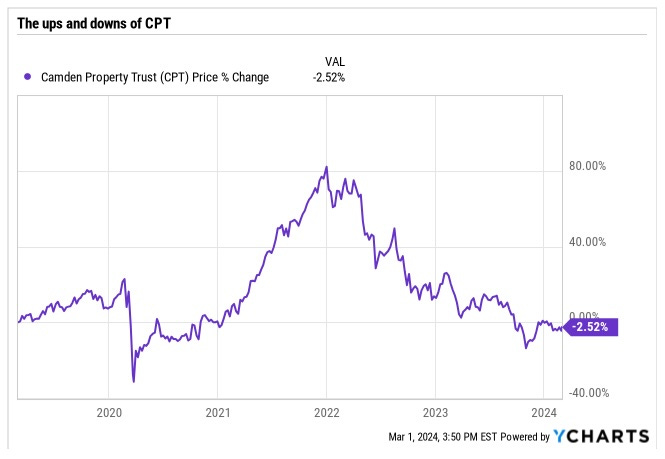
From a price near $90 in 2018, CPT climbed 20% before the pandemic but then found itself back near $90 in mid-2020. I bought in March of 2020 and held for upside, with a very brief break, until November of 2021.
At first my view was that CPT was very undervalued. By July, 2021, after a rise of 50% in price, I came to view CPT as a growth position.
By November, after another 20% price increase, my judgement was that they had risen too much, as detailed here. I sold then.
The price started dropping through the 2022 and 2023 bear market. I bought back in at $85 in November.
So this seems good to me. Buy from Mr. Market when he panics and sell when he is euphoric.
But what is CPT really worth? Let’s see.
The Story of Ten-Year Price Returns
It is typical in articles to see a discussion of 10-year trends. Well here is the (13-year) price record for sunbelt-focused CPT and for coastal-focused AvalonBay (AVB), shown as growth of $10k.
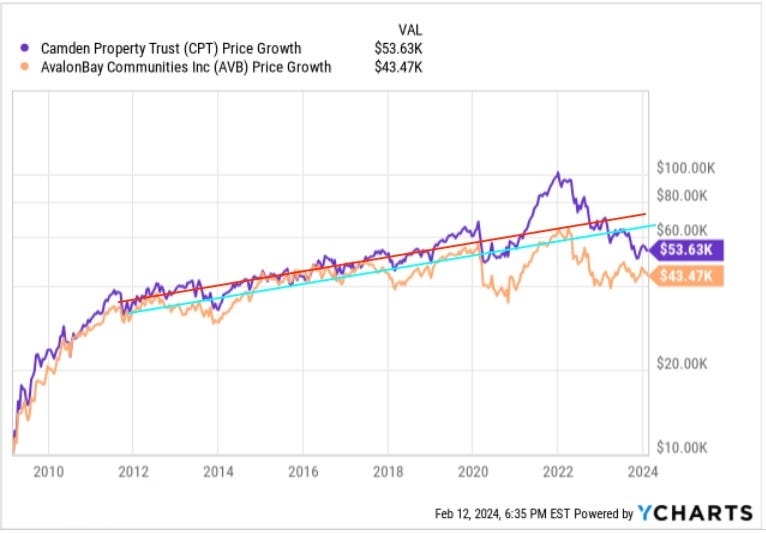
This is a semi-log plot. The two overlaid lines show compounding at about a 6% rate. So we might think this is the sensible long-term estimate (more later on that).
Since 2019 we can see the pandemic pessimism, the over-reaction to very high post-pandemic rent increases, to Camden being in the sunbelt, and to ZIRP. After that is the current period of depression over high interest rates and temporary high supply of apartments in the subelt. So we might think these two REITs are underpriced today.
Look Further For Better Context
The thing is, you should just quit reading any article that makes its argument based solely on the past 10 or even 15 years. That has been the period of extreme Fed support for asset prices, which certainly seems over.
Grounds for more caution is found in a 21-year chart, shown here:
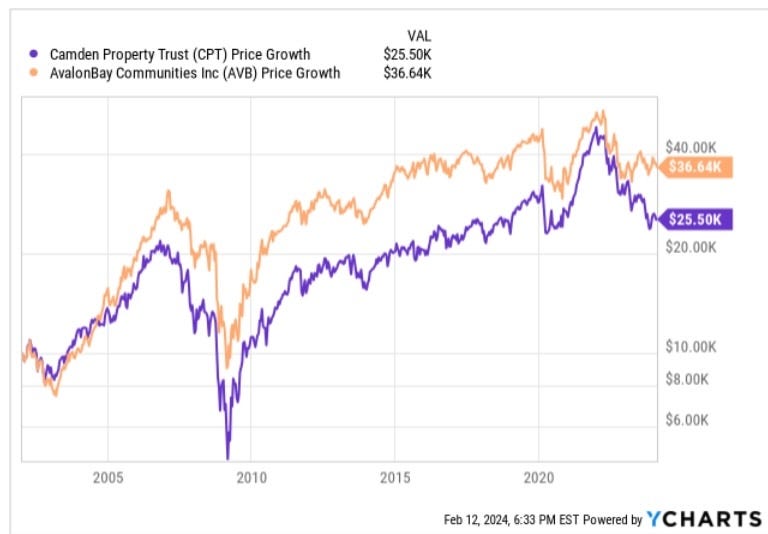
If you bought either CPT or AVB at the peak in 2007, your gains from there to the present boil down to about 1% per year. Worried yet?
If you bought in 2002, your CAGR to the present would be within 150 bps of 5%. (Not including dividends.) So once again we see that you make your money, or not, on the buy.
A funny snippet is that during 2007 and some of 2008 Camden was buying back shares. The reason was that private-market, real-estate prices were so much higher than the valuation implied by the price of CPT in the public markets. Oops.
Think about that in the context of the present. Many REIT stocks, including CPT, seem severely undervalued based on a comparison of REIT prices with private-market prices. Well, in 2007 both turned out to be severely overvalued.
If interest rates stay high or move higher, which could happen (though I don’t expect it), then that could be true again now. Worried yet?
You should wonder whether CPT could again plunge in price by a factor of 4 and take a decade to recover. So far it has just gone half that far. We will revisit that question later.
Risks?
It matters to address risks, but doing so after the whole story tends to lose the thread. So we do that here.
All the big, blue-chip, multifamily REITs are running a proven business model. They all carry low leverage (more on that for Camden below). They all grow per-share earnings in all the ways that we will see for Camden.
It seems to me that it would take both economic stagnation and population declines (neither of which I expect) to interfere with the growth model. And even then internal migration might sustain it in some locations.
In the meantime, rent will be volatile and earnings growth will not be steady, for any of these REITs, as always for apartments. Some of that will be reduced by geographic diversification, but not all of it.
As always, the 10-K for Camden includes an exhaustive discussion of mostly arcane risks. Good bedtime reading.
To my eyes, for Camden specifically the primary long-term uncertainties relate to the eventual overturn of management and to other corporate events. Among other things, at their size they could get bought out.
The future also looks a lot more secure than the past was, as we discuss next.
Long-Term Challenges
To seek clues about the longer-term potential of Camden, we need to know what was going on during the first decade of this century. Why was there so little net growth of cash earnings? Could there be a repeat?
The obvious answer is “The Great Recession, dummy,” but that is not the full story here. Look first at some earnings measures:
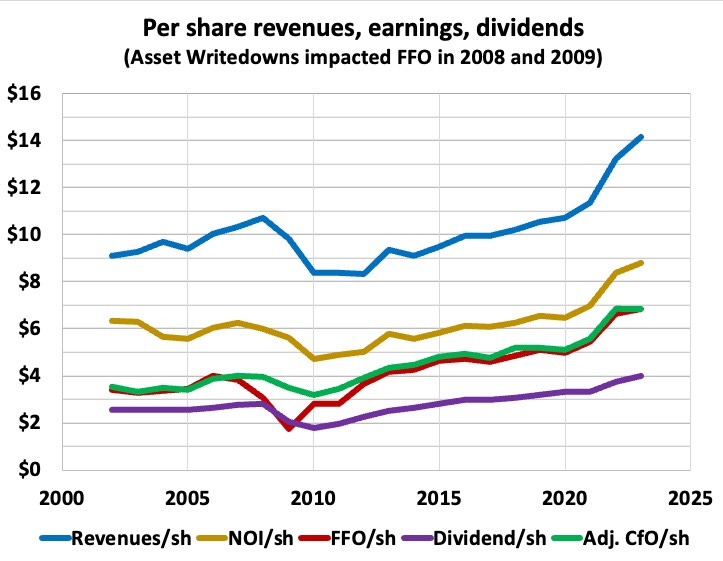
The first few years seen here had their difficulties. NOI/sh, Adjusted CfO/sh, and dividends increased modestly at best and certainly did not keep up with revenues. Then they all dropped through 2010 before recovering slowly.
[Here Cash from Operations or CfO has been adjusted by removing changes in working capital. For the rest of the article when I refer to CfO I mean the adjusted value.]
The outlier is FFO/sh, shown in red. It dropped thanks to the inclusion of non-cash impairments in FFO (eliminated from the FFO calculation toward the end of the Great Recession). Since then FFO/sh and CfO/sh have tracked closely, as they should when GAAP is not screwing things up.
But more changed across that period than revenues going down and up. Note that CfO/sh increased as a fraction of NOI. Here is why:
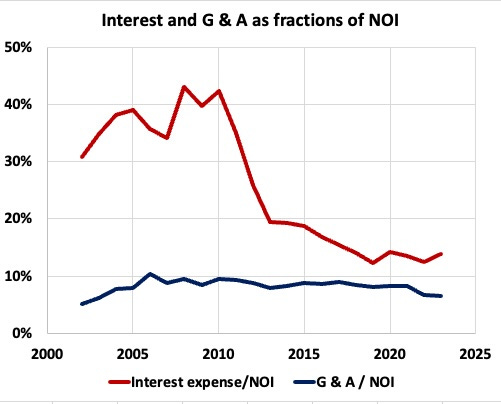
Interest expenses were near 40% of NOI in 2005 and G&A was at 8%. With dividend payouts at 46% of NOI, there was too little cash left for maintenance expenses plus (capitalized) interest on construction. Camden had put itself in a risky place.
Remarkably, though, they did nothing about it until after 2008, when the sum of the above items went essentially to zero. Then they did this:
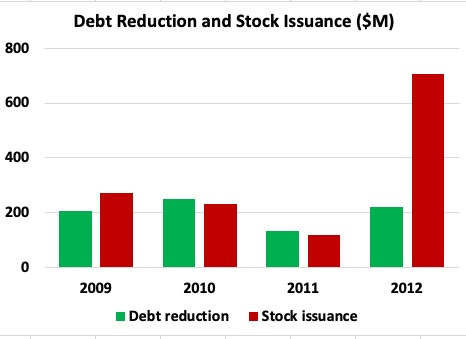
Although from a quick skim I see little relevant discussion in the earnings calls, what they did was to deleverage on the backs of the shareholders. Dilution of shareholders by 55% enabled Camden to pull the debt ratio down below 40%, as you can see here:
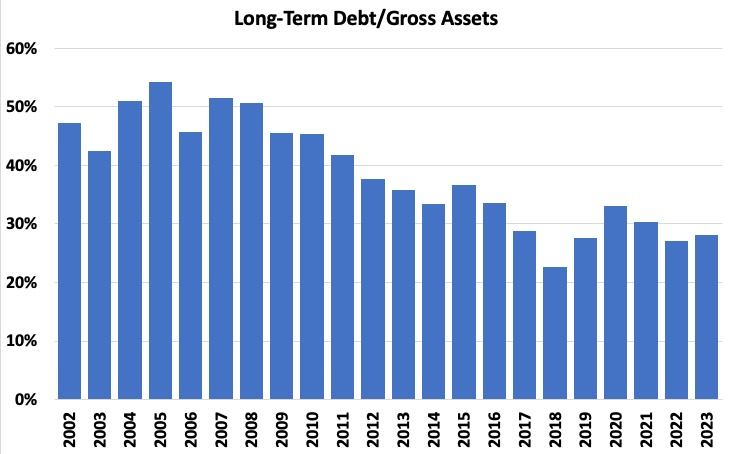
This, combined with cutting the dividend by a third and some improvements in NOI, pulled the sum of expenses for interest, G&A, and dividends down well below 100%. At that level the remaining funds could more than cover the other expenditures.
From there Camden worked that debt ratio down to the 30% ballpark where all the big multifamily REITs live today. To get interest expenses back to more than 40% of NOI at their current debt ratio would take interest rates well above 10%.
That low leverage today protects them from increasing interest rates and other kinds of turmoil. Even if residential real estate collapsed like it did across the Great Recession, Camden would not need to dilute shareholders.
Plus, having pulled the dividend down to about 60% of cash from operations in 2010, Camden kept it there. So a next, similar economic event likely would not lead to a dividend cut.
Feel better? You should.
Growing Earnings Today
Now we know enough to focus on the past decade comfortably. The weak performance of the prior decade was due to a combination of too much debt and too high a payout fraction. Things are structurally better today.
Across the recent decade, Camden has seen about 80% of CfO flow through to Funds Available for Distribution (CfO less recurring capex and capitalized interest). They have paid out less than 80% of FAD as dividends. That 80% is a common ratio for many REITs.
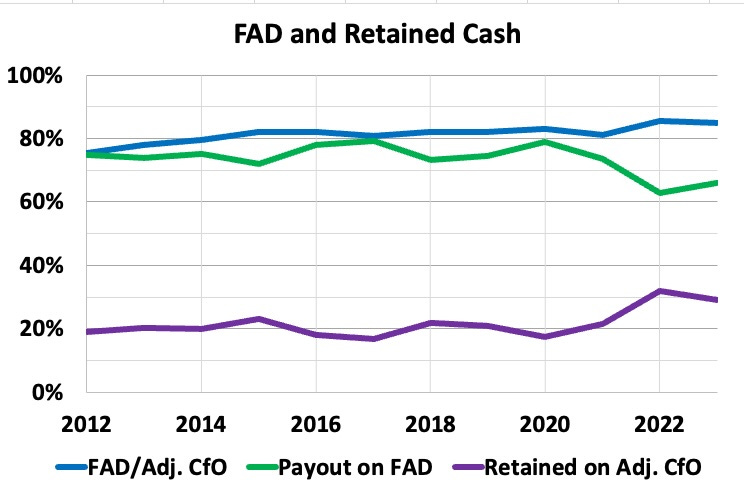
This has made about 20% of CfO available for internally-funded growth (shown as the purple curve). But 2022 and 2023 were very hot markets for rent increases by sun belt REITs, pushing that fraction up.
Camden kept dividend growth steady and generated about 30% of CfO for such growth in these recent years. They did not push up the dividend growth rate in response.
That seems good to me; in the usual cycles of apartment REITs, great years are often followed by poor ones. We certainly expect that here, thanks to broad oversupply in the sun belt at the moment.
If Camden invests that long-term 20% of FAD at a 5% investment yield, they will generate FAD growth of 1%. The details are nuanced, and I discussed some of them here.
For acquisitions, after “Camdenizing” new facilities, rents typically increase so that the effective cap rate is larger than the sticker price. Plus, development is more lucrative so using the funds that way can produce larger growth.
The rest of acquisitions and development, funded by dispositions and issuing stock, is less lucrative per dollar. Most of the overall acquisitions and development are funded as we can see here.
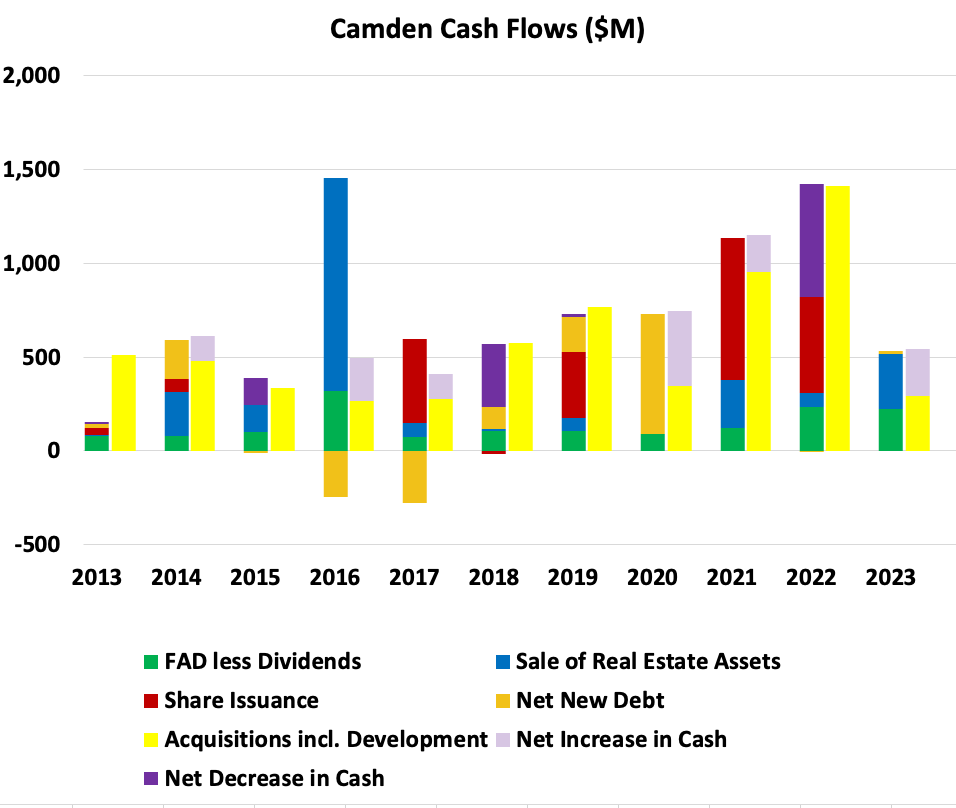
These cash-flow plots are quite informative. Let me show you how to read them.
There is a pair of stacked bars for each year, with sources of cash on the left and uses of cash on the right. Across the entire plot the most dominant color is yellow, showing acquisitions (including development).
But FAD less dividends, shown by the green bars, only pays for a small part of the acquisitions in most years. The rest is covered by selling of assets (blue), issuing shares (red), and adding debt (tan). [The tall blue bar is from 2016, when they exited Las Vegas.]
One thing notable about all these categories is how tactical Camden is with sources of cash. They vary a lot from year to year.
This also includes very active management of their cash balance. In various years they add (light purple) or withdraw (dark purple) a substantial amount of cash.
There was quite a bit of share issuance in 2019, 2021, and 2022 when shares were highly priced. To me, the plot reads like they do not really like debt. On net across this decade, debt (tan bars) was only 10% of their sources of funds.
Whether one is selling new stock or selling assets, it is tough to get a really big spread between the lost CfO/sh from selling and that gained from the new assets. Spreads between 1% and 2% are common.
For Camden, the funding from stock and from dispositions is comparable and is about 1/3 of CfO from each. So one might expect growth of CfO from these sources to be in the ballpark of 1%.
In total, the growth in CfO/sh from the combination of retained cash and fund raising should be near 2%. If rents and expenses just stayed with inflation, this would be the long-term growth rate of real cash earnings.
Now consider the growth of rents. Apartment rents fluctuate not only seasonally but also with supply and demand. We seek a longer-term perspective.
On the one hand, there is inflationary rent growth, which will also vary with time. On the other hand, part of effective management of a diverse portfolio of real estate is to increase growth by going where the market will be hot. This might add a percent or so to real earnings growth.
It seems clear that these together will exceed 1% and be well below 10%. Suppose they add up to 3% per year. This would get you a 5% total CAGR of CfO/sh. Well, take a look:
Expecting a (ballpark) 5% CAGR of dividends and CfO/sh seems reasonable to me. If we do get a period of higher inflation, nominal growth should over time be larger and keep up. Considering Camden’s demonstrated versatility in making it happen, this may not depend on favorable stock markets.
Another view on this aspect is provided by this comparison:
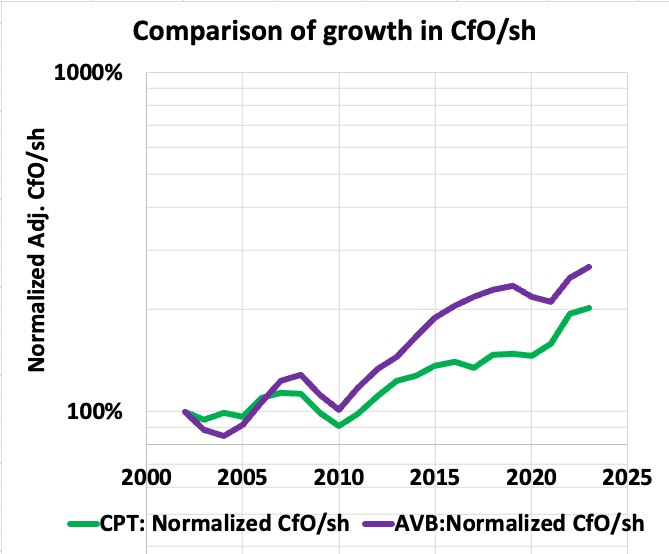
AvalonBay did better at navigating the first half of the period shown, growing earnings by 30% more over the first 12 years. Since 2014, though, the growth has been similar. The CAGRs are 5.5% for AvalonBay and 5.3% for Camden.
So What is this Worth?
Where we end up is this: Camden gets you about $6 in FAD/sh. It will grow at a bit more than 5%, give or take a bit.
My current approach, discussed here, involves finding the discount rate that prices a REIT stock near NAV, because this explains the main features of market pricing of REITs. For Camden parameters the curve looks like this:
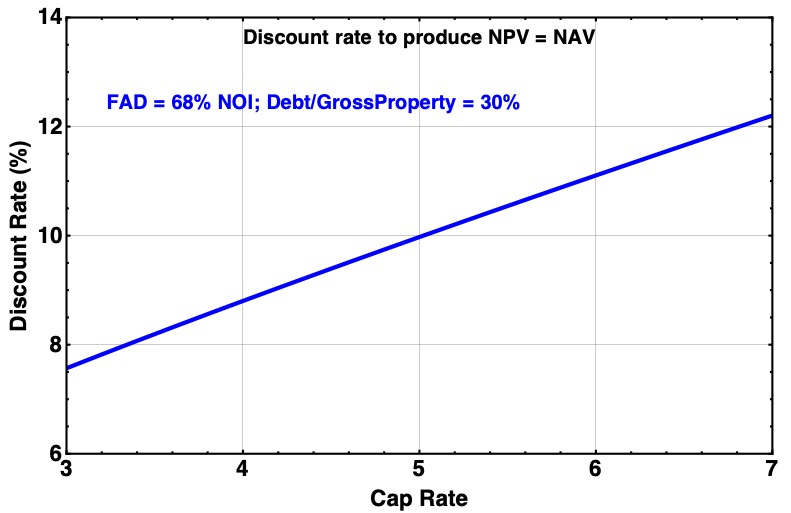
Camden is doing some development at (stabilized) cap rates that approach 6%. And the point of that is to get higher property values post-stabilization. And they had at least one disposition last year at just above 4%.
Taking 4.5% as a reasonable median, we might use a discount rate of 9.5% ± 0.5%. This will change as interest rate changes are followed by cap rate changes.
If we then evaluate discounted cash flows under various assumptions, we can get this:
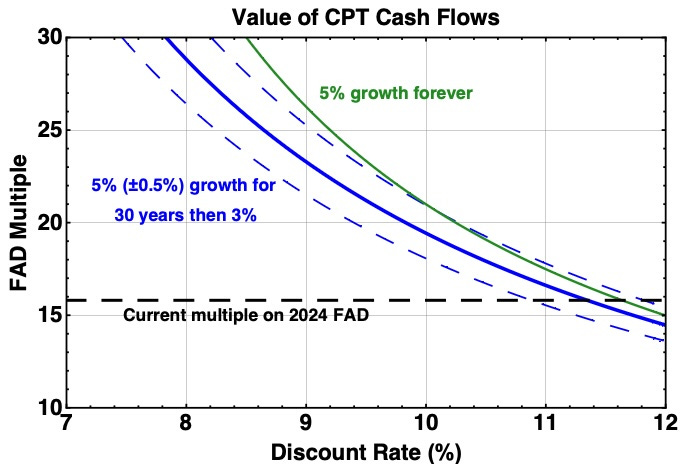
A central FAD multiple here is 21 for current cap rates. As one should always expect, the uncertainty is significant. (I giggle every time an author gives a fair value to four significant digits.)
Looking at the full range of discount rates and growth rates, one gets an implied price of $126 ± $24. The range that is likely is smaller. My conclusion is that you are unlikely to lose money buying at below $100 and might make 25% to 50% upside even if interest rates and cap rates don’t move.
Noting that 10% to 20% market price fluctuations are common, it seems likely that I will get my $125 price target. Then, if indeed interest rates and cap rates move down, even 50 bps, the value of the Camden cash flows goes up 10% or more.
To translate the above into the more common but often misleading metric of FFO/sh, divide by 1.13. That gets you a target P/FFO of 18.5x.
There are not so many REIT stocks that have tens of percents of likely upside without needing a boost from declining interest rates. It looks to me like CPT is one of them.
Today I see CPT as a good investment for upside and a moderate investment for income or growth. In my view, risk of substantial permanent principal loss is very small.

Thanks for the question, David. That is how I see it, on the assumption that P/E ratios stay constant. Any significant secular trends could have "temporary" impacts that last awhile.
Paul
To summarize, if I buy I get 4% + 3% + inflation as a reasonable expectation over time? Is that about right? So a 2% inflation => about 9% return? 7% plus inflation is nothing to sneeze at.