


Focused Investing Perspectives #54: Cap Rate Data

There is some new data on historic cap rates.
But before I get to that, some thoughts about the S&P 500. It has been flat since before the start of the year. That pulls down total return:
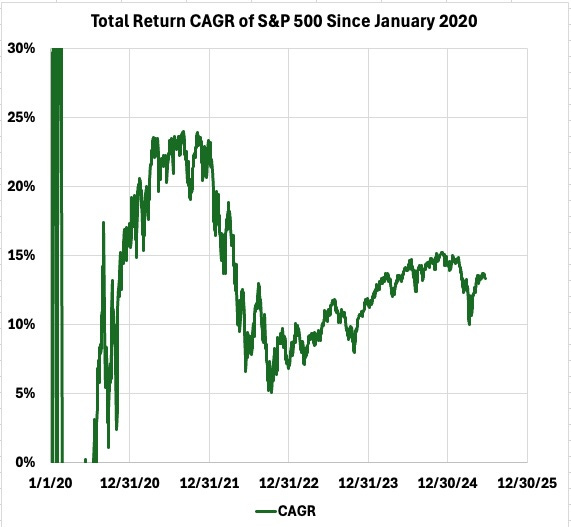
If the index stays flat for 13 years, as it did starting in 2000, the CAGR of total return will drop to 5.5%. Strangely, that is the dividend yield on my own portfolio, paid by companies with rock solid balance sheets and good growth models. As a retiree, this makes more sense to me.
New Data on Historic Cap Rates
The markets were once again boring this week. What excited me much more was new data on cap rates. [A cap rate is the ratio of Net Operating Income from a property to the property value.]
The challenge here is that the computerized records one can easily access almost never go back 45 years, to the peak of interest rates and inflation. So, through 2021, they entirely reflect the extremely long, secular bull market for bonds.
In real estate, it was 35 years ago that cap rates moved below 10-year Treasury Rates. This gave rise to the modern era of spread-based investing. And most records one easily finds do not even go back that far.
The intellectual problem is that the idea of leveraging a positive spread is taught today as though it came down from the mountain with Moses. But the recent (well, 35-year) structure of real-estate investing is not a religious certainty.
This makes it worthwhile to understand earlier eras, with which the next era might rhyme. And I have looked in vain for data about that.
It turns out that so has Hines research, as discussed in this report. Recently Hines found data for life insurers from 1965 forward. It was based on cap rates on properties for which the insurers extended loans, an average of 520 per quarter.
Hines also found rent data from the OECD. They produced this plot:
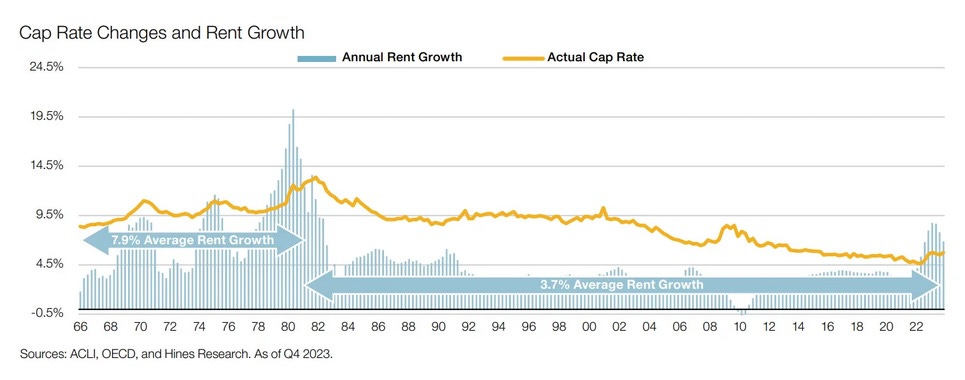
CRE Daily summarized the report and this plot as follows:
Looking back at the 1966–1982 cycle, Hines research shows that rising cap rates didn’t stifle real estate income—they strengthened it. Rents grew at an average of 7.9% during that inflationary period, nearly doubling the growth rate of the cap rate compression era. With construction activity at historic lows globally, similar conditions could be forming, positioning real estate for robust income growth—even as valuations adjust.
That meant that, over the cycle, growth of rents outpaced the CPI by 38%. More importantly, if one leveraged a real-estate investment with debt at fixed interest rates, the value of the debt fell more than 3x over that period. Many homeowners and other real estate investors, including me, took advantage of this to generate huge return on equity during that period.
One might think that such an inflationary period might suppress real-estate construction. But if you look around at fred.stlousfed.org, you find that across that cycle construction employees increased by a third and single-family housing starts increased as well.
One other thing you might notice in the plot is the historic flatness of the cap rate before 2002. And you might recall that the period from 2002 to 2021 was the period of active interest-rate suppression by the Fed. The long-term data before that makes it seem like a cap rate of 9% might be normal.
A sobering thought: getting there would require at least a 20% downward adjustment in property values, from here.
Both of these aspects suggest prioritizing real estate income over potential asset appreciation. It seems to me that the quality of that income matters far more than today’s price relative to some alleged value.
Member News
Looking Ahead
It has been a long time since I looked closely at Equity Lifestyle (ELS), a manufactured housing REIT. They have some complex aspects that make me distrust simple metrics for them.
The price of ELS is 15% below the prepandemic peak and is near the lows of 2021, 2022, and 2024. But CfO/sh is up 30%. It makes sense to take a look.
I have gefun some work on Vermillon Energy (VET), as suggested by a subscriber. That may take awhile. Complex company with complex history.
And as usual, I’m musing on some analytical questions which may lead to other articles.
Recently published material
Material in the past month has included the following 13 items. You can see it all, and search it, at https://focusedinvesting.substack.com/
Recently:
Deep dives with no paywall on Tourmaline Oil, Front View REIT, and Kite Realty Group
Deep dives with a preview on VICI
Five Brief Notes
On EOG resources, on macroeconomics, and on Canadian REITs, to all subscribers.
On some price action and on Orion Properties, to paid subscribers
One Trade Alert, exclusive to paid members.
A monthly update, with a preview
Paid members also have access to the Focused Investing Chat.
Other Resources
To find my past articles covering a given company, go to the Focused Investing home page. There is a search function to help look for past articles. Search by name or ticker.
A note on my approach to restricting access: Anything providing details of my trades and portfolio is restricted to paid subscribers, as is anything I consider to be immediately actionable. Most articles with information it seems members may act on have a preview section followed by a paid section where the real meat is.
The Google Sheets (for annual members):
The main attraction on the Google sheet is full disclosure of my live, real-time portfolio. If you are an annual paid member and do not have access, please contact me.
There are in addition a REIT assessment sheet, some data from NAREIT’s REITWatch, and a Midstreams assessment sheet, each a tab. And if you scroll down on the Current Portfolio tab, you can see limit orders, some tickers I track, and some playing with possible portfolios.
Also:
Paid members can also post items of interest on the Focused Investing Chat, which I do often. Check it out and post your own items, please. Comments and questions are always welcome.
It can be challenging to search the chat (for paid members only) or to find past articles on mobile devices. To do so, you have to get into the chat so my picture is on the top left, and then punch my nose with your finger (ouch?). You will see a display with a search emoji and a link to the home page where you can search.
Please click that ♡ button. And please subscribe and share. Thanks!
Those historical cap rates are a little frightening.. Especially since it appears era of free money is over... Looking forward to VET review... I have position in low 6's but many different opinions about VET future. Debt load? Are assets in NA and Europe to your liking or not-please let us know...Thanks Paul
I always enjoy reading your musings. I really look forward to the ELS analysis. It's an interesting space.