

Brief Note: EOG Resources


Am I turning into Warren Buffett, in some ways?
No claim here to be his parallel as an investor. But increasingly I seem to be less enthused about fiction and also about TV. More enthused about investor presentations and 10-Ks. Go figure.
EOG Resources (EOG) has never appealed much to me, despite their US-leading inventory, which they claim to be 10B boe. Their dividend yield has been too low.
So I decided to take a look, just for fun. My main resource was their current investor presentation, along with some basic financials.
EOG brags about their cash “return to shareholders.” Really? Let’s see.
Of their $1.3B of Free Cash Flow, they paid $500M as dividends and repurchased $800M of stock in Q1. That’s 0.8% and 1.3% of Market Cap, respectively.
For comparison, Canadian Natural Resources (CNQ) paid 5% of market cap as dividends and repurchased 3% of market cap in 2024. And 85% of that dividend is the base dividend, that they expect to pay during trough periods for oil prices.
The charitable interpretation of this difference would be that EOG is doing high capex to drive growth that would pay off later. The uncharitable interpretation would be that Canadian Natural has a better business model.
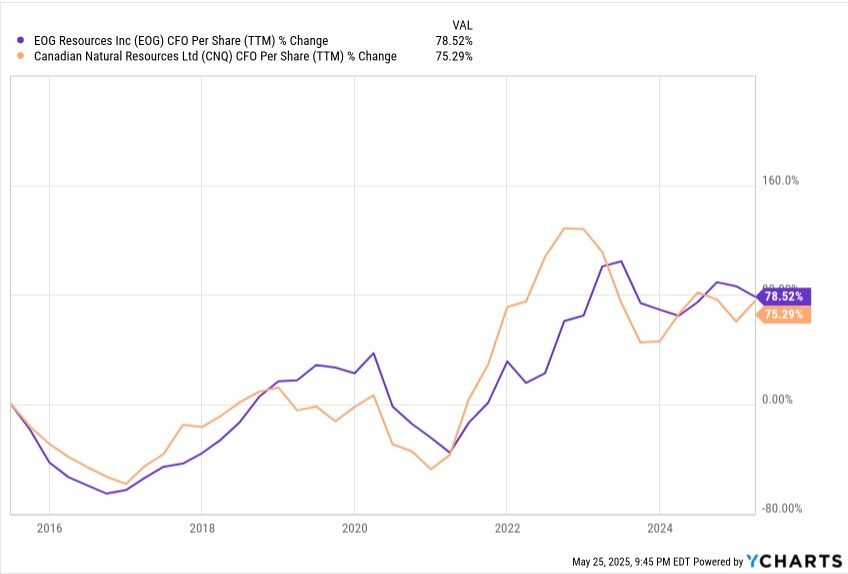
As a first look at business models we check growth of per-share Cash from Operations or CfO/sh. They both grew this about the same amount.
In this kind of business, differences will show up in how much capex is needed to sustain and grow CfO. This comparison is relevant:
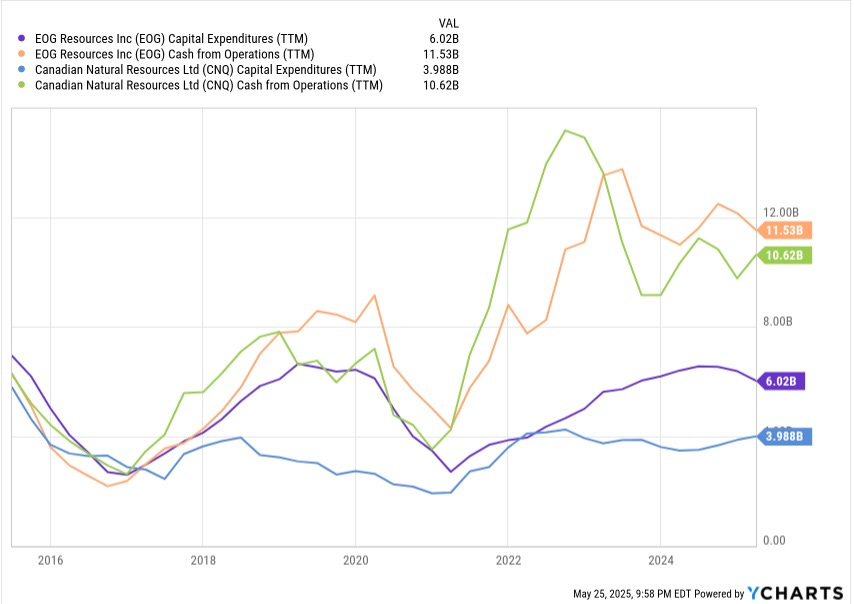
Today, capex for EOG is 50% larger than for CNQ to support the same level of CfO. And the difference was MUCH larger from 2018 through 2022. Both are sustaining production with only modest organic growth, if any. So today CNQ is a better business.
Now CNQ is mostly an oil sands business and EOG is focused on shale in the US, but the difference here is not due to that. Montrose Environmental Group (MEG) is an oil sands business whose ratio of capex to CfO looks like EOG’s, roughly speaking.
The difference is that, during the decade before 2018, CNQ invested enormous capex in becoming able to “upgrade” the oil from their oil sands mining. And beyond that, they have driven down “lifting costs” across all their oil sources by persistent innovation. Today they are reaping the rewards.
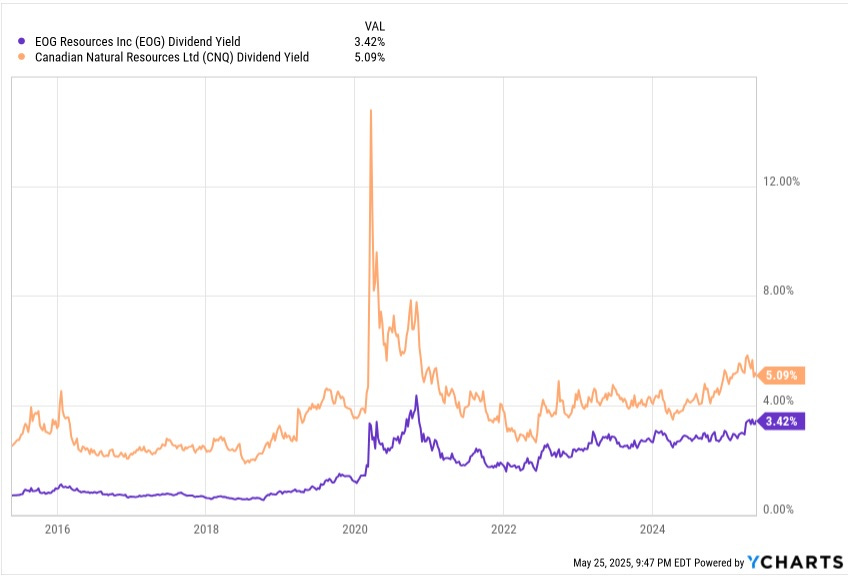
And given the differences just described, no wonder the EOG dividend yield has always sucked by comparison to that from CNQ:
So EOG may stand a lot longer than other US producers thanks to their inventory, but my take is that the market persistently overvalues their stock.
As to activities, football season usually changes all that. We’ll see this year.
Please click that ♡ button. And please subscribe, restack, and share. Thanks!
I bought heavily into CNQ while they were still making those investments in upgrading but not yet in full production. I picked off dips as low as $18 CAD and just kept waiting for production to get going. Then boom, production ramps up, div ramps up, stock ramps up, I'm close to 3X on stock price alone ($42.51) as I write). It was obvious those investments would pay off and they did.
So, this analysis was very interesting to me, but CNQ is just a long term hold for me now.
What I really want is another CNQ circa 2018.... :-)
Great insight about the similar cash from operations but heavier CapEx at EOG.
CNQ also benefits from the narrower WCS discount after TMX startup and the suspension of imports from Venezuela.