


VICI Properties: Finally Fully IG


Now that VICI Properties (VICI) finally got their third investment-grade credit rating, what are their prospects?
In the myth, Zeus ate something that did not sit well (a goddess) and this was cured when his head split open and Athena emerged fully grown. A few millennia later, Caesars ate something that did not sit well (debt), and this was cured by bankruptcy and when VICI emerged during 2017.
With initial total assets above $10B, they were a large-cap REIT from the start. Now, less than 8 years later, their total assets exceed $45B.
[An aside on the assets: GAAP accounting classifies nearly all the VICI leases as “sales-type” leases because of their size and duration. The result is that depreciation does not apply to those leases. So in contrast to most REITs, for them Total Assets and not Gross Assets is the most relevant GAAP-balance-sheet measure of their actual total assets.]
VICI got bigger by purchasing casinos, with price tags in the $1B and up range. Examples:
Purchased the Greektown Casino-Hotel in Detroit for $1B in 2019.
Paid nearly $1.5B during 2019 and 2020 for three JACK Casinos in Ohio.
Purchased MGM Growth Properties for $17B and The Venentian Resort for $4B in 2022.
Purchased the remaining interests of Blackstone (BX) in the MGM Grand Las Vegas and Mandalay Bay Resort for $5.5B in 2023.
At the same time, though, the deals got less lucrative. Early on, Caesars was desperate as they emerged from bankruptcy and VICI got some of the properties at cap rates above 9%.
But by the time VICI bought the Venetian, they only got a cap rate of 6.25%. We will look more closely below, but by my calculation the stock-fueled aspect of that transaction was not accretive to shareholder value.
Overall the trends have been clear. Since 2022 their acquisitions have been much smaller on average, slowing their rate of asset growth. In addition, the cap rates have been modest. For example, during 2023, they bought 38 Bowlero properties for $439M at a 7.3% cap rate.
But despite those challenging cap rates, VICI has a good record of growing AFFO/sh. You can see this here, including current guidance for 2025:
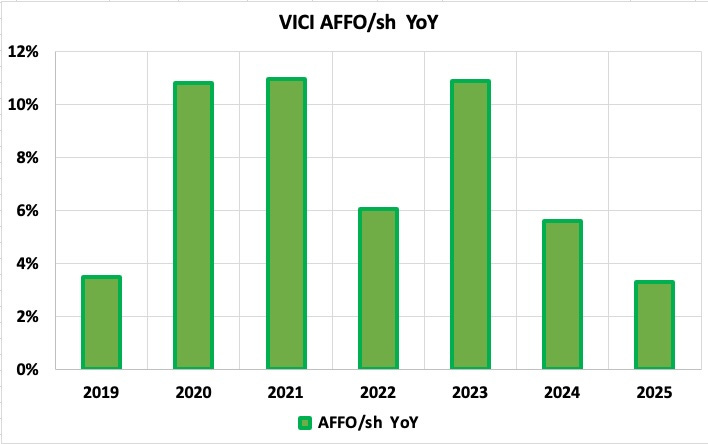
[Per-share AFFO (Adjusted Funds From Operations) turns out to be reasonable for VICI as a measure of cash earnings. We discuss some nuances below.]
I have to admit that 2023 surprised me at the time, though I was not paying detailed attention until the end of that year. What has not surprised me is the decline in growth since. We will see why below.
Additional Introductory Context
Before turning to the meat of the analysis, it seems worth noting some additional context.
Triple Net
VICI is a Triple-Net REIT. Their leases are triple-net leases, under which tenants are responsible for all maintenance, insurance, and taxes. In addition, some tenants are on the hook for a specified level of capital investment into the properties. This is essential to maintain the appeal of those properties.
The VICI leases are long, with a 41-year weighted-average lease term. In addition, a number of them have provisions for long extensions.
Importantly, the leases include escalators. These are disclosed very well in the Supplemental. They average about 2.5%. Many of them feature a 2% floor, scale with CPI above that, and are capped at 3%.
The combination of long leases and few, large properties enables VICI to operate with among the lowest relative G&A costs. These run about 2% of NOI.
Balance Sheet
VICI emerged in 2017 with a shaky balance sheet. Improving it has been a focus since. In April 2022 they got BBB- ratings from S&P and Fitch. After that analysts pumping them routinely described them as “investment grade.”
But the Moody’s rating was stuck in junk, at Ba1, until last November. So now they are entirely rated investment grade, but one can also view BBB- as borderline junk.
The issue seems to be tenant concentration and no wonder:
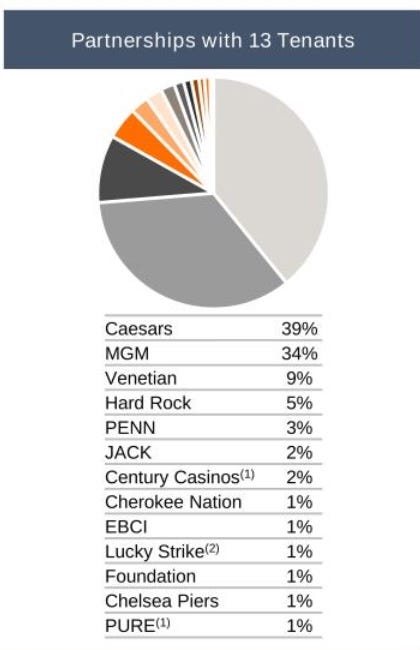
That too is a lot better than it was before 2022 when they added MGM and the Venetian. But still it is very concentrated by any standard, which adds risk.
We’ve seen this movie many times. If Caesars or MGM get in trouble at the level of bankruptcy, this may have bad consequences for VICI shareholders.
The good news in that context is that Debt/Total Assets has run in the mid-30s and is now at 34%. Based on what we’ve seen with EPR Properties (EPR) in particular, VICI might survive a Ch. 11 bankruptcy by one of their big tenants without needing to cut dividends or dilute shareholders. Growth of earnings and dividends would likely be impacted, though.
Earnings and Cash Flows
Let me start here with some commentary about earnings measures for VICI.
VICI does not report Net Operating Income (NOI) let alone cash-basis NOI. NOI obtained via the income statement is substantially impacted by non-cash items.
A number of non-cash distortions flow through to Nareit Funds From Operations (FFO), also making this worthless.
In their evaluation of an Adjusted FFO (AFFO), VICI removes these distortions. They do introduce one of their own by adding in transaction and acquisition expenses, but these are tiny.
And because AFFO is mainly trying to get to a cash result, no wonder AFFO is quite close to Cash from Operations (CfO). Changes in working capital are small enough that there is no need to adjust CfO.
In addition, both maintenance capex and capitalized interest are quite small, as can be true for triple-net REITs. The consequence is that Funds Available for Distribution (FAD), CfO, and AFFO are very close to equal.
So in my view their AFFO is a reasonable earnings measure for them, which is not true of most REITs. If you want to see the details, here they are:
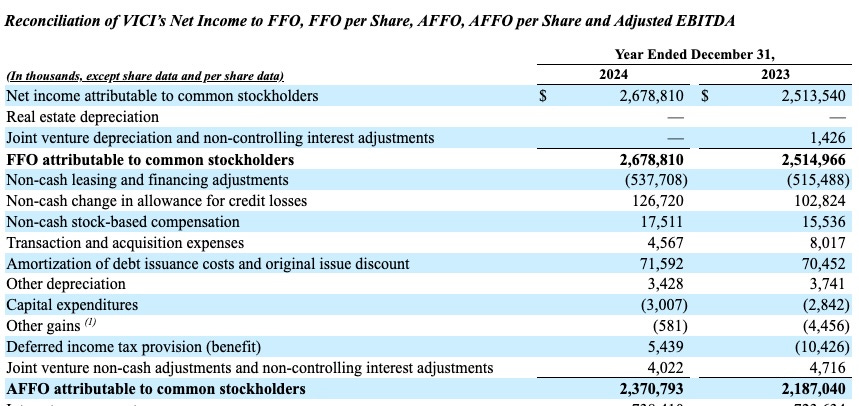
Considering the growth of AFFO/sh shown above, it is no surprise that the CAGR of the dividend since 2018 has been 8.8%.
This next graphic displays the cash flows. It is in my usual format where the left stacked bars represent sources of cash and the right stacked bars uses of cash:

Here the green bars show the retained cash (CfO less dividends). This can be reinvested at the Return On Equity (ROE) of the REIT.
The the red bars show the stock issued on the market. You can see that, except in 2024, this has been a lot larger than retained cash.
Mergers have an independent effect. Across 2022, total assets increased by $20B and net debt increased by $7B. Only the portion involving actual flow of cash is reflected in the chart.
The gray bars show net debt issued. Here again there was additional debt taken on, not shown here, in association with the 2022 mergers.
In the uses of cash, the yellow bars show property acquisitions and the brown ones show the loans. We can see that 2024 was different, with retained cash larger than stock issuance and with loans exceeding acquisitions.
So far so good. But all is not perfect. We turn next to more challenging issues.