


The RPD Portfolio Across 2024


Context, evolution, trades, reasons, and outcomes. Overall a good year.
Writing this annual article, thinking through and writing about my investing over the past year, is a highlight for me. It is a chance to get some perspective on what I did and why.
Short-term gains are not at all the point, although it is always nice when I buy a position that quickly moves where I think it should go. With my average hold at about 9 months, a one-year lookback seems sensible timing.
Also note that this article is recounting what I did last year. It does not disclose my specific current positions, save incidentally. My paid subscribers see those.
Macroeconomic Context
With my focus on REITs and energy, two of the central driving elements are the interest rate on 10-year Treasuries and the benchmark price of crude oil. For REITs, the Treasury rate is by far the dominant factor because of its connection to cap rates. Energy is a more complex sector (upstream, midstream, downstream, oil, gas, NGLs) but somehow the price of crude seems to have an outsized impact.
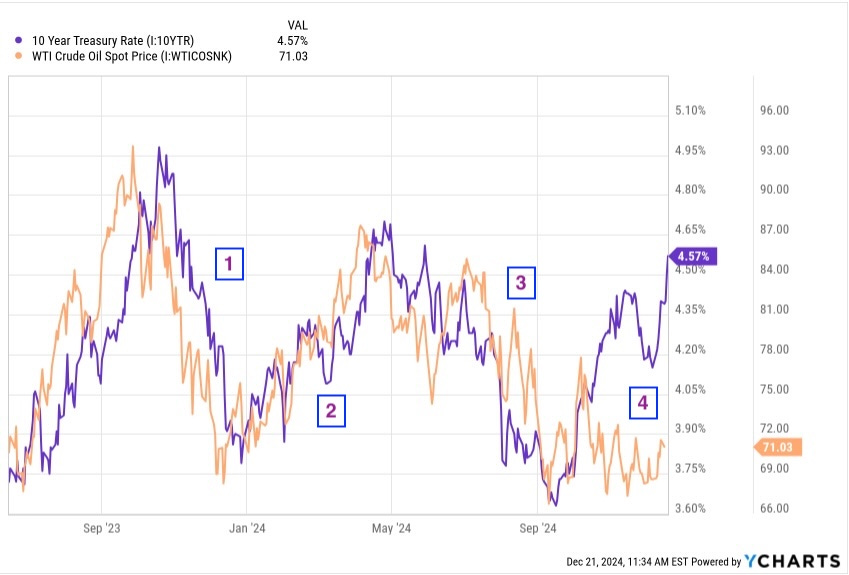
The four labeled intervals in this graphic featured alternating periods when interest rates and oil prices rose or fell together. In period 4, oil prices stayed down while interest rates rose.
It was an atypically volatile year for the Treasury rates. An improved outlook in late 2023 was followed by increases in early 2024 as the prospects of near-term cuts by the Fed faded to nothing.
Then things were looking up over the summer and rates dropped until the Fed finally cut rates by less than some had hoped and telegraphed a slower rate of cuts going forward. Rates have increased since, save for a brief delusional period before the December Fed meeting.
Oil, in contrast, was typically volatile. Curiously, it tracked Treasuries for much of the year, producing some strong gains for me as prices increased until May. Since then, though, prices have come down and stayed down.
Upstream oil firms react the most (and too much) to these fluctuations. Today a lot of them are good values, based on midcycle oil prices.
We will see below how my trades reflect the movements of these underlying prices.
Evolution of Focus
My emphasis has been primarily on dividends for income for some years now. I see a reliance on total returns as much more risky within the full historical context of things that might go wrong.
Historically, dividends have suffered much less than stock prices during downturns including recessions. I reviewed the long-term performance of the S&P 500 and the 21st century performance of my sectors recently here.
Still there are variations in risk, which mainly correlate to leverage. A favorite historical example of mine is Camden Property Trust (CPT), a current holding.
Camden entered the Great Recession with a Debt Ratio (Net Debt to Gross Assets) of about 60%. Interest rates were 40% of NOI before the recession. Cash earnings dropped to 40% of NOI by 2010 and they cut the dividend by a third.
After substantial shareholder dilution from 2009 through 2012, Camden got their Debt Ratio down to 40%. They have pulled it down further since. In a repeat of the property crash from the late 2000s, they would not have to cut the dividend.
Until recently my portfolio has included Armada Hoffler (AHH), discussed here. Financially they are similar today to Camden from 20 years ago. AHH has paid a much higher dividend yield than CPT. That seemed worthwhile to me with close monitoring, until for reasons discussed shortly my portfolio goals changed.
During late 2023 and most of 2024, I made a number of decisions that reduced my ongoing cash flow needs. Major among these were the allocation of my “cognitive decline” funds to annuities at the interest-rate peak in late 2023 and paying off my last mortgage in midsummer 2024.
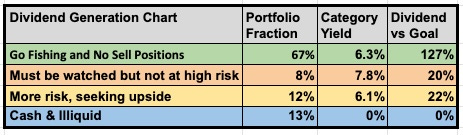
As a result, my cash flow needs with no work dropped below my dividend income. And it turned out that my very secure, “Go Fishing” stocks were paying more than that, with a significant cushion. My 2025 Go-Fishing Portfolio will be published next week.
Understanding this also made me comfortable in letting the total dividends drop a bit. That let me push the portfolio fraction in my “Upside Bucket,” seeking strong gains, back up to its long-term target of 20%.
Here is my dividend distribution as of December 22.
Aside from the dividends, my current part-time work (plus secure income) substantially covers my spending needs. While that lasts the dividends can help the portfolio grow faster.
Going forward, I will continue to trade those Go-Fishing stocks. The point will be to exploit market fluctuations to increase dividend income with little risk. This requires thorough understanding and close monitoring of the companies involved, which is what I do.
If my upside investments succeed, that will further boost total portfolio value. Most of the gains will also serve to grow the dividends too.
All of which takes us to the question of how it went in 2024. Let’s take a look.
Overall Gains
The portfolio began with a certain after-tax value in January of 2020. To see the total value added, it makes sense to look at the current value plus the total of all withdrawals for spending.
My goal is to sustain a viable retirement and improve my legacy. There is no index I am seeking to beat. My approach is to make one good investing decision at a time.
Beyond that, one does not expect value investing generally to keep up with the S&P 500 (SPY) during its hot periods. Since the start of 2010, that index has produced a CAGR of total return of about 12.5%. The equal weighted version (RSP) has managed about 8.6%.
The year of 2024 has certainly been a hot one for these two indices. Through Dec 31, the SPY is up 23% and the RSP is up 11%.
Here is how the value of my holdings plus withdrawals has compared to those two indices, monthly, starting five years ago:
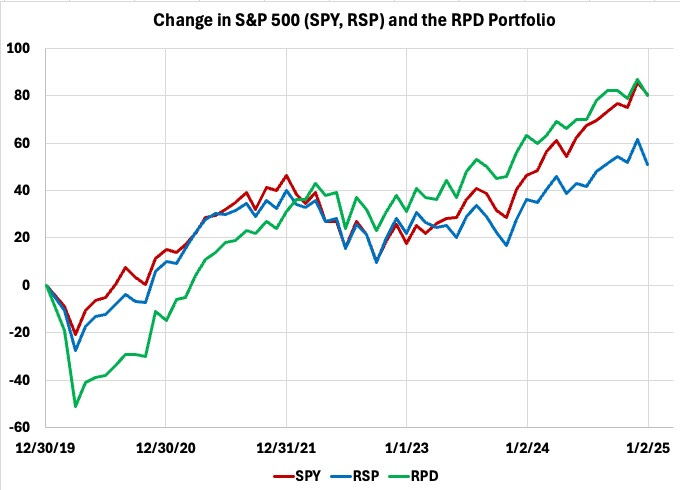
For 2024, my portfolio (green curve) gained as much as the RSP (blue curve). Having fallen behind during 2022, the gains in the SPY (red curve) finally equaled mine for the 5-year period. For that 5 years, my portfolio remains well ahead of the RSP.
Overall, the firms I hold are priced for slow growth. The REITs have a weighted ratio of Price to CfO/sh of about 14x; they are near fully priced for current interest rates. The energy firms have a weighted P/CfO ratio of 7x, with a Free Cash Flow yield in the ballpark of 10%, overall underpriced still. These are comparatively safe investments, as both the RSP and SPY are priced above their historic PE ratios.
More importantly my portfolio of companies has more secure business models than most. The portfolio value has grown through partial reinvestment of dividends and by exploiting market irrationality. This has gone better than one would expect. Either I’m good at this or just lucky.
Going forward, with my greater focus on dividend security it would seem likely that the growth will slow. Time will tell.
The next part gets into the weeds, in case you are interested.
Positions Reduced or Sold in 2024
During 2024 I sold all or part of 19 positions. Here is a summary.
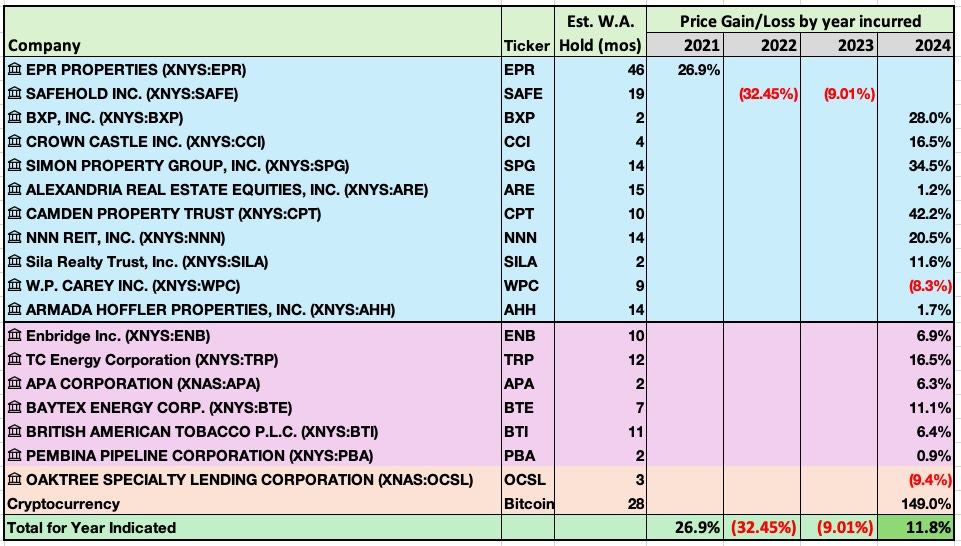
There is a distinction between when a gain or loss is realized and when it impacts portfolio value. To help make sense of what my portfolio did this year, I added columns here for the year when the primary gain or loss affected portfolio value.
My gains in EPR properties (EPR) were substantially all in 2021. Since then it has been a cash cow. I eventually expect more gains but have not seen them yet.
My losses in Safehold (SAFE) happened mainly in 2022 and some in 2023. Today SAFE is a leveraged play on interest rates. Not having high conviction about the direction of those rates, I sold SAFE last summer to raise cash for the transitions discussed above.
The gains or losses on the other positions primarily occurred in 2024. As you can see, most of them were held for 12 months or less.
The overall total from the year, based on total dollars, was a gain of 11.8% on positions that closed. This next table shows more about my reasons for acting and the portfolio impact of that investment:
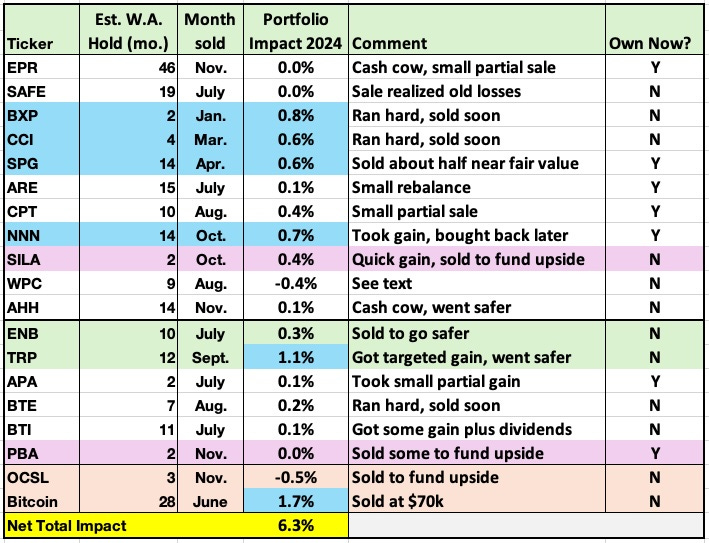
The cells shaded blue show the six sales that represented an increase in portfolio value above 0.4%. If, for example, a 3% position gains 20% before sale, that transaction increases portfolio value by 0.6%.
The pattern is clear. The price increases in REITs triggered by period [1] led me to sell three REITs early in the year. The oil price increase in period [2] produced gains on small energy positions sold in July and August.
That oil-price increase may well have contributed to price increases in midstreams. My purchase of TC Energy (TRP) had reflected my judgement that the market over-reacted to some bad news for them a year earlier.
By total impact, TRP was my most successful investment closed in 2024 (save for Bitcoin — see below). By rate of gain, it was BXP REIT (BXP).
I sold TRP and Enbridge (ENB), and also AHH and SAFE, in the summer. All supported the transformation to lower required cash flow discussed above.
As period [4] developed, a lot of upstream energy investments became compelling. This was when I sold some positions, shaded purple, to increase my “Upside Bucket,” seeking strong gains. Realizing that will mostly await the turn in oil prices, which might be next year or a few years from now.
The biggest portfolio impact was from Bitcoin (BTC), not really part of the patterns described above. I bought in early 2022, following conversations over time with my son.
BTC promptly dropped 2x. Of course.
In 2024 BTC finally ran hard. I pulled out my initial investment in March and sold at $70k in June (get rich by always selling too soon). No decision now about playing a next cycle.
During 2024 I closed out two positions that resulted in a loss of portfolio value across the year. It was disappointing to learn from the Q3 release that Oaktree Specialty Lending (OCSL) showed another incremental increase in nonaccruals. But mainly I was looking to expand my upside positions, seeking gains far above the 10% loss I took leaving.
Then there was W.P. Carey (WPC), which I discussed here. The financial troubles of one of their major tenant, Hellweg, seem clearly related to debt. And overall we have terrible disclosures from WPC about rent coverage and the financial status of their tenants.
My concern here is Europe, where everybody drank the ZIRP cool-aid far longer than we did in the US. I see risk in that, while everybody trying to sell you something sees low risk because there will certainly be a return to very low interest rates. My take: maybe, maybe not.
For now, I’m staying away from European real estate unless I have a much clearer window to tenant health.
Assessment
In assessing a decision, the question is not how much you gained or lost. Rather, it is whether you think it reflected good thinking and analysis.
So far at least, my decisions in 2024 strike me as good-quality ones overall. Perhaps I should have paid more attention to my weak confidence in BDCs generally, despite my overall admiration for Oaktree.
To my mind, learning from my losses on W.P. Carey (WPC), perhaps they should have had to prove their progress before I invested. But if you wait for that you often miss the gains.
It would seem unreasonable to me to expect to never take losses. Having only two, each in the 10% ballpark, seems like a decent year.
In sum, I don’t see significant weaknesses in my processes and thinking. If you do, please share them in the comments.
Please click that ♡ button. And please subscribe and share. Thanks!
"I see a reliance on total returns as much more risky within the full historical context of things that might go wrong."
I'd pay to see you and Dale Roberts in the same room...ha
I view your performance as impressive since your portfolio of higher income, safer securities matched the performance of the S&P 500 for the past 5-year period during a strong growth/tech bull market. Please keep up the good work!