


Armada Hoffler REIT: Heroes or Villains?

The recent earnings call made many investors fear that Armada Hoffler (AHH) was about to start diluting investor earnings just to build their empire. This article explores the details, seeking the answer.
Armada Hoffler should be a failure but is not. Overall “Diversified” REITs have a miserable record of growth. That category has by far the worst historical performance of the NAREIT categories of REITs.
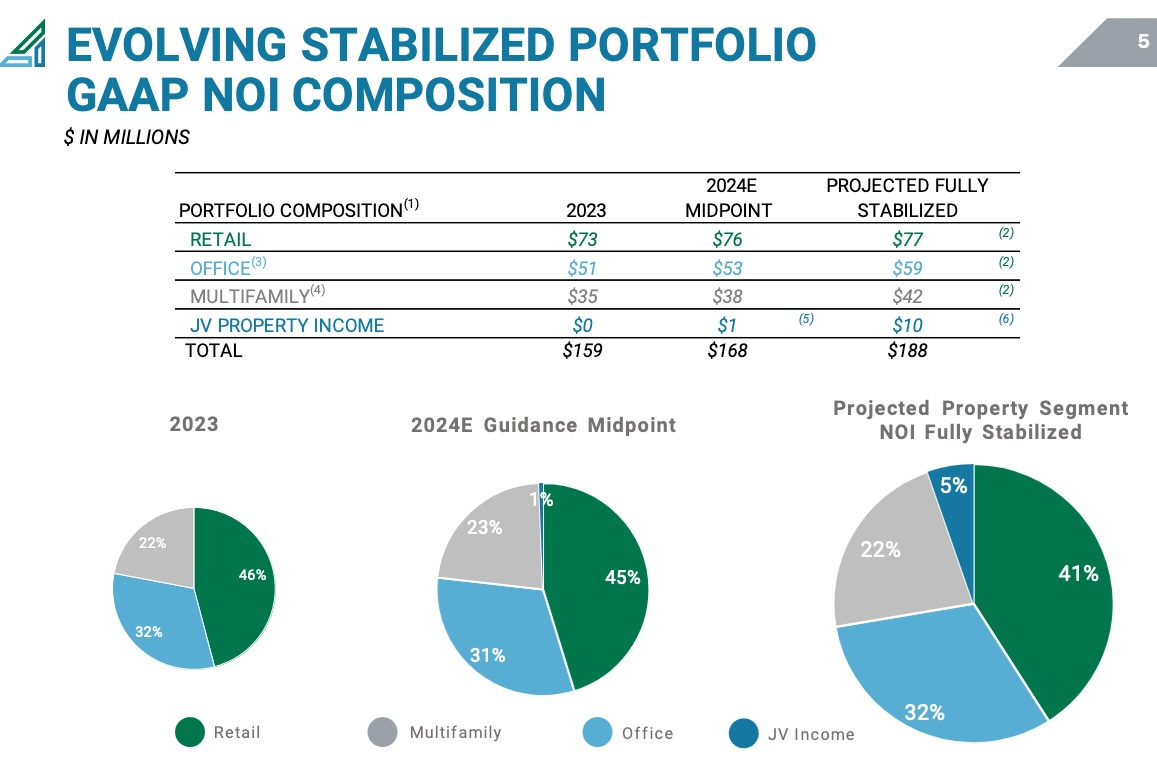
And Armada Hoffler is diversified: they hold office, retail, and multifamily properties. The fractions are all large, as you can see here:
Some REITs, such as the former Washington Real Estate renamed ELME Communities (ELME), have found office to be extremely expensive. They complained about it for years before finally deciding, mid-2021, to be rid of it all.
ELME took a big hit to their assets and earnings, and cut the dividend nearly in half. Their Cash from Operations per share is down nearly 50% since 2019.
Other REITs, including Realty Income (O) and W.P. Carey (WPC) have sold or spun off their office assets more recently. There was no cut to the dividend of Realty income. There was only a 20% cut to the dividend of W.P. Carey, but half of that was resetting the payout ratio to allow more internally funded growth.
In sharp contrast, the office properties of Armada Hoffler have an occupancy of 95.3%. They shared on the earnings call that such a high occupancy would normally call for starting new projects, but that those do not pencil out with present capital markets.
There are two secrets to this success. One is that Armada Hoffler emphasizes having the best, A+, trophy office buildings in neighborhoods with little competition. The other is that the office properties are mostly part of their own mixed-use developments.
Mixed use has been an increasing theme among the big REITs with substantial resources: for example Simon Property Group (SPG), Federal Realty (FRT), and Regency Centers (REG). Small-cap Armada Hoffler has been doing it for decades.
As to geography, Armada Hoffler extends from Washington DC down the Atlantic coast and over to Atlanta. So while their geographic distribution is not as broad as that of many REITs, they are reasonably dispersed.
Early Years
Although Armada Hoffler is about 40 years old as a company, they are only 10 years old as a REIT. So they are still climbing their way toward a REIT-standard balance sheet and learning other lessons discussed below.
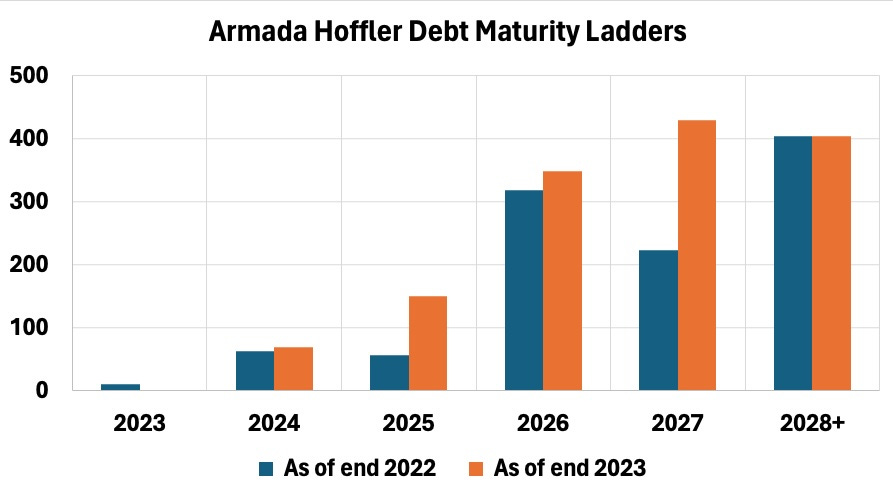
Here are the current debt maturity ladders from the last two 10-Ks. You can see good progress, with little debt maturing in near-term years and later years spread out:
In addition, they got a BBB rating from Morningstar DBRS in January of 2023. What this does is get them good rates in the private-placement debt markets. It is a next step on the path to an investment grade rating from major agencies, which would get them into the public bond markets.
We can see a bit more about the business of Armada Hoffler from their display of Net Operating Income or NOI. From the recent Q4 2023 presentation:
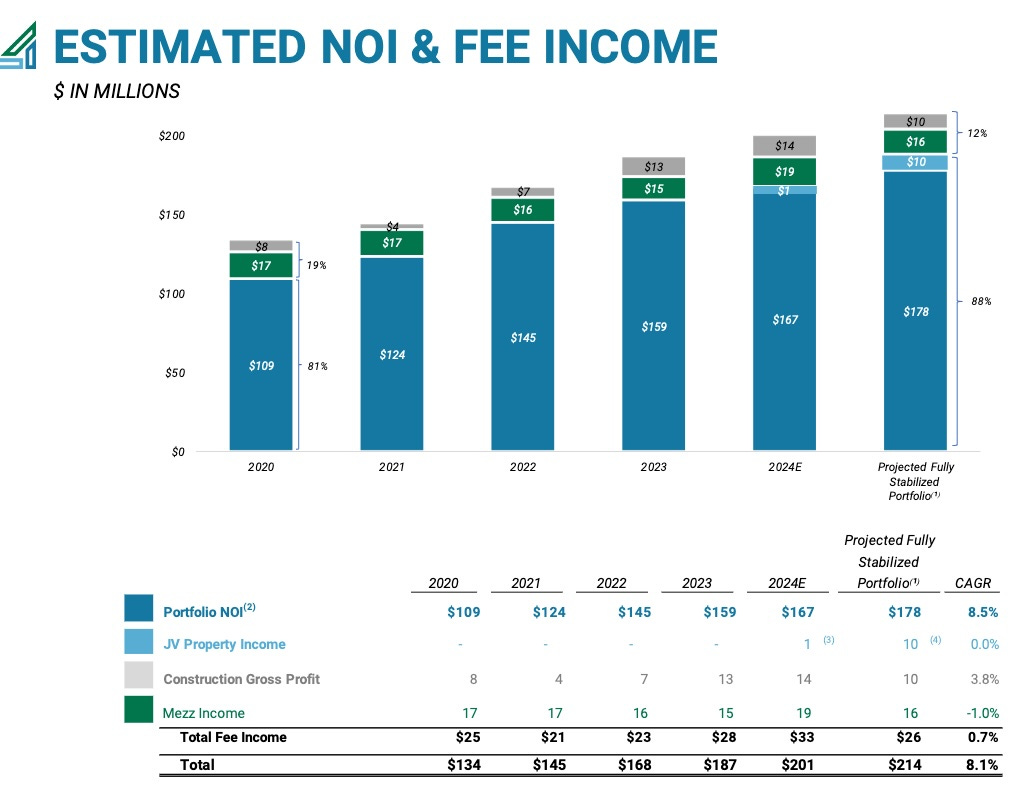
Here the big, dark blue bars show the Portfolio NOI, from their operating properties. They supplement this with income from making Mezzanine loans (a category including preferred equity investments), from doing construction for others, and recently from Joint Ventures or JVs.
These supplemental income sources are all small and we won’t discuss them in detail here. They do come up below in the context of paths to forward per share growth of cash earnings.
The above gives us context for interpreting this next image. It shows the progress over time of various earnings measures, on a per share basis. This includes Cash from Operations or CfO and Funds From Operations or FFO.
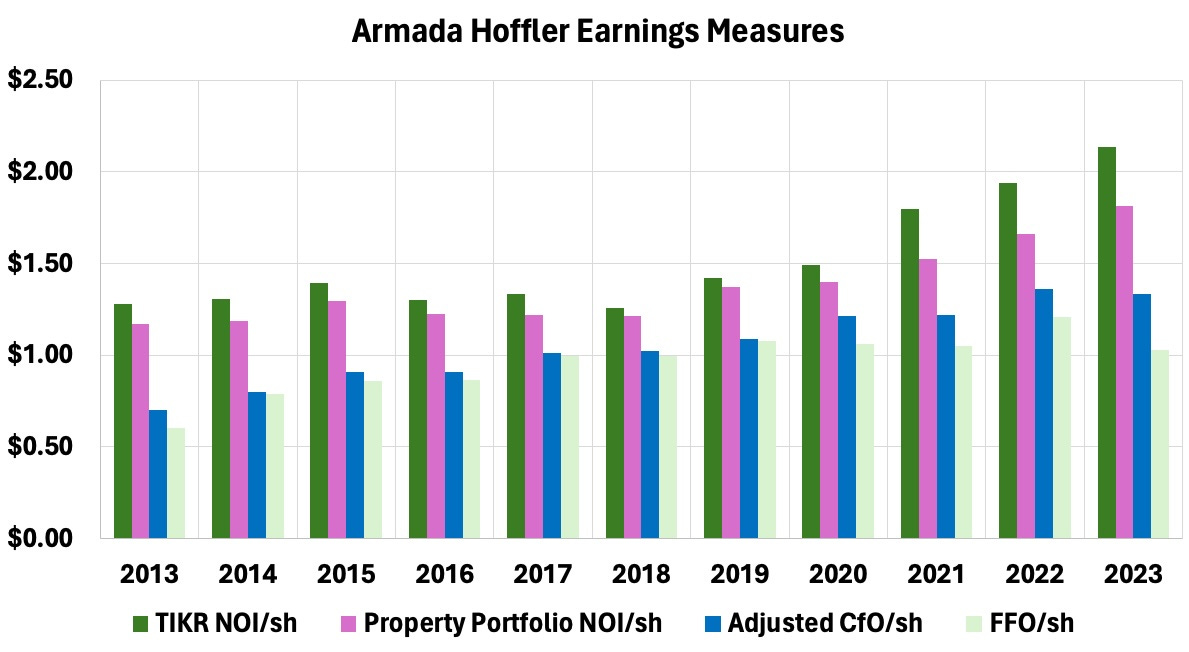
The TIKR NOI is Revenues less Property Expenses. The Property Portfolio NOI is from the 8-K Supplementals. CfO is from the cash flow statements and FFO is as compiled by TIKR.
But, as is often true, TIKR gets the share count wrong for these computations, because it fails to include the OP units. Armada Hoffler at times uses these aggressively to help them with acquisitions. The plot above uses unit counts from the 10-K filings.
What we see is that the TIKR NOI/sh is a bit larger than the Property Portfolio NOI/sh, which is consistent with the plot shown previously. The drop down to CfO/sh is due primarily to interest costs, as is the decrease in CfO/sh from 2022 to 2023.
[Here by CfO/sh I refer to Adjusted CfO/sh, with changes in working capital taken out of CfO.]
The fact that CfO/sh and FFO/sh differ in recent years implies that GAAP is distorting the earnings (though this is a mild case of that). The issue is not noncash contributions to revenues, as one can see in places where Armada Hoffler reports both cash basis and GAAP NOI for various segments.
Instead, the problem is exactly what Warren Buffet complained about in his most recent annual letter. Changes in the unrealized value of various holdings must be reported as part of current income.
[In fairness, the “NFFO” or Normalized FFO that Armada Hoffler reports differs from FFO mainly by correcting for this issue. But is also includes other, smaller elements that I would describe as SEC-compliant cheating, no differently than many other REITs].
So as is often true, it is CfO/sh that we should look to as a measure of cash earnings before any capex. From 2013 through 2023, the CAGR of CfO/sh has been 6.7%. That of NOI/sh has been 5.2%.
Seeking FAD
To get from CfO to FAD we need to find two things. One of them is recurring capex, listed by Armada Hoffler as “Tenant and building improvements.” The other is capitalized interest, though this is not huge for them.
Armada Hoffler does have pretty good disclosures, so this is not hard. Here is the result:
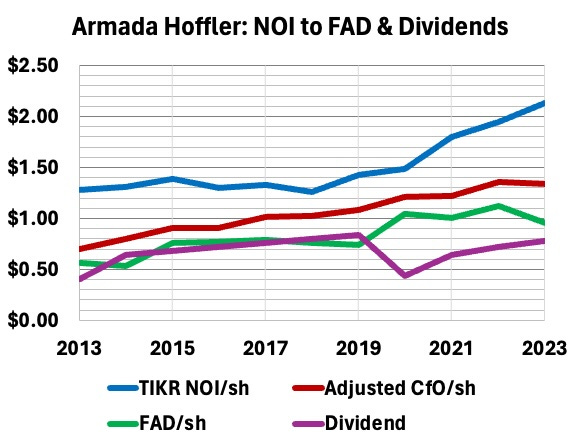
For reference, you can see NOI/sh and CfO/sh, both shown above. FAD tends to run near 80% of CfO, which is not uncommon for the sorts of properties held by Armada Hoffler. But the ratio does fluctuate.
The dividend payout is interesting. Once again we see a newly listed REIT making the mistake of setting the dividend too high.
The dividend ran roughly 100% of FAD through 2019. Then in 2020, out of an abundance of caution, the Board suspended the dividend for one quarter and then restored it to half its former level.
But as you can see, Armada Hoffler did not suffer a noticeable loss of cash earnings in 2020. Plus, they held back on maintenance capex with the result that FAD/sh actually increased.
Since then, they have pushed the dividend back up to just above 80% of FAD. In my view, they should not push it higher and could achieve better forward growth if they pulled it down near 70% (see below).
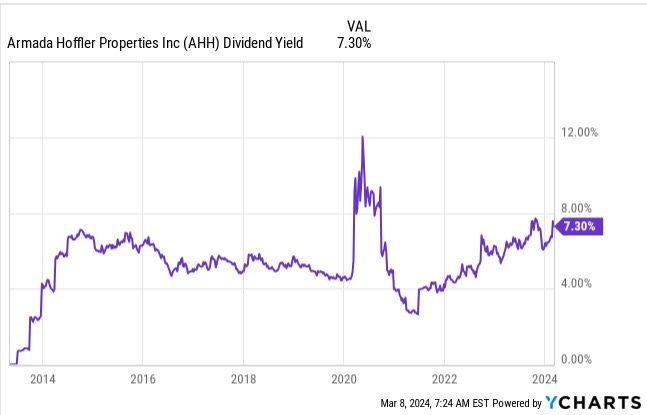
But the jury is out still on whether they learned their lesson. Uncertainty about this would justify some discount on their pricing. But the yield went way too low in 2021 and seems too high to me now, likely from fear of their office properties:
Cash Flows and the Business Model
Seeking a better understanding of how they grow earnings, we look at the cash flows. There are enough categories that a plot showing all of them requires a lot more study than really makes sense. So I grouped some categories together to get this:
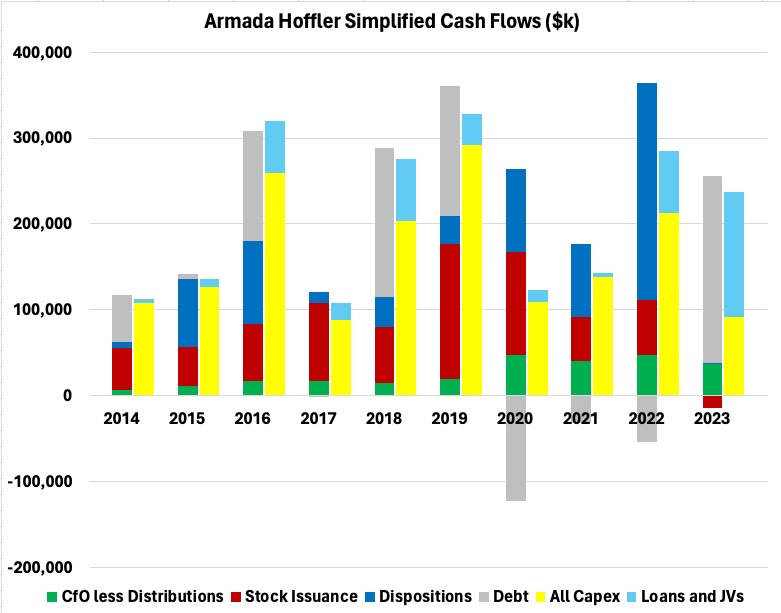
This graphic has two stacked columns for each year. The left stack shows sources of funds and the right stack shows uses of funds.
Their uses of funds are dominantly capex (yellow bars), which includes development and acquisitions in varying amounts. They also make some loans and invest in Joint Ventures (light blue bars), usually with a minority of the funds.
Retained cash (green bars) is a powerful source of growth. It has been larger lately with the smaller payout ratio. We can hope it stays there.
Until last year, Armada Hoffler sold a lot of stock (red bars) to enable growth. But last year, to their credit, they responded to the low market price of their stock by issuing none and buying back some. (This year is discussed below.)
Regular dispositions (blue bars) are part of their plans. They build more than they keep and sell the rest. This became a much bigger fraction across the pandemic, enabling them to pay down debt.
And then there is often quite a lot of debt (gray bars). They have run about a 60% ratio of Debt to Gross Property, which is very high for a solid REIT.
With debt reduction across the pandemic, that ratio dropped to 51% in 2021. But it is back up above 60% now.
At their current averaged interest rate of 4%, interest expenses run 31% of NOI. But that would go to 45% if all the debt rolled over at a 6% interest rate.
This is about where Camden Property Trust was before the Great Recession led them to deleverage with substantially dilution of shareholders. So while that 60% is a reasonable target in a private-equity environment, as a public REIT seeking a high reputation, they will eventually need to bring it down.
Looking for Growth
Those backward cash flows show that Armada Hoffler variously used stock issuance, dispositions, and debt as its main sources of growth capital. And that they did not issue stock last year when their dividend yield was so high.
But one comment in their Q4 earnings call led to a lot of consternation among stockholders. CFO Matthew Barnes-Smith said this:
We anticipate, as soon as we come out of blackout period here and we file the 10-K that we will go into the ATM. Obviously, the equity price is not exactly where we want it to be, so we will be somewhat conservative with that. But in order to grow, we need to add some equity to the model, and we anticipate doing that throughout the whole of this year.
That quote certainly makes it look like these guys are empire builders who are willing to outright dilute shareholders, doesn’t it? And it did light off a whole lot of worried commentary by investors. The problem with that interpretation is that over many years and many calls, they have NOT behaved that way.
On top of that, the typical way of thinking about modern spread investing is not accurate. Return on new equity, which is what matters, does not directly depend on the difference between a cap rate and some weighted average cost of capital or WACC.
I learned how it really works from three-time REIT CEO Chris Volk (see his book, The Value Equation). First ask what debt does.
Debt leverages up the invested equity. The total investment (whether a straight acquisition, a development, a loan, or preferred equity) is the invested equity divided by (1 minus Debt Ratio), where Debt Ratio is the ratio of new debt to newly invested funds (Gross Property for properties). [Note that the real activity is lumpy, but REITs do target a chosen Debt Ratio over time.]
That investment creates NOI as some cap rate or cash-on-cash return. So in the absence of corporate expenses, the ratio of acquired NOI to invested equity is the new NOI divided by (1 minus Debt Ratio).
The return on equity is this ratio times the fraction of NOI that is not lost to corporate costs (giving FAD on net). Here debt enters again as one of those costs is interest expenses. Here, for assumptions relevant to AHH, is the relationship of Return on Equity to cap rate:
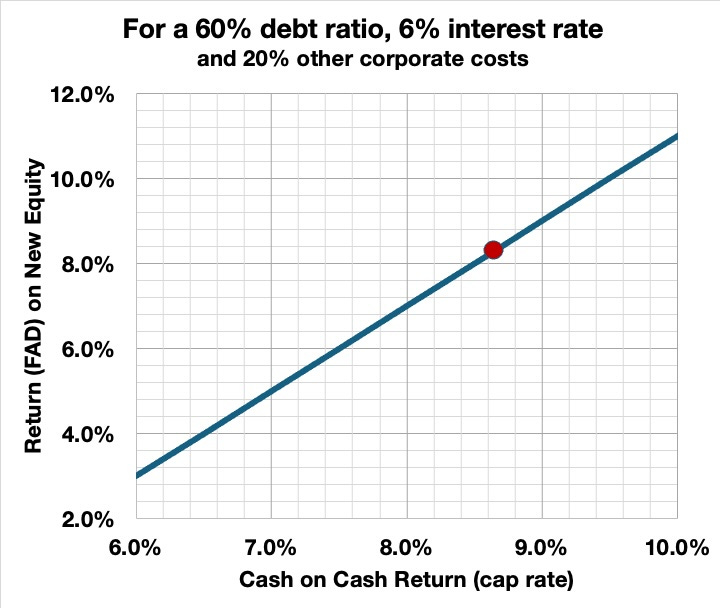
These come out equal at about a 9% cash-on-cash return. At smaller such returns, the interest costs are large enough to suppress the return on new equity below the cash-on-cash return.
Again I emphasize that all this has nothing to do with “costs” of other sources of cash. At the end of the day, if the return on equity just discussed exceeds those costs, on a per-share basis, then the investment adds to the value per share of the stock.
That’s it. Interest rates and costs of new equity do not enter the math as a sum related to the usual WACC.
What matters next is those costs. So let’s look at them for AHH today, which will get us to the red dot on the graph. I summed them since their IPO and applied today’s costs to get this:
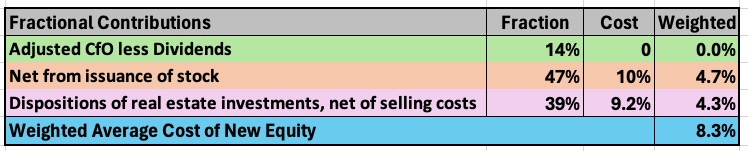
There are three sources of new equity. The only one most (nearly all) authors talk about is the cost of equity raised by issuing stock. For AHH that has been less than half the total equity raised.
By issuing stock, you cost shareholders the corresponding share of FAD. With a dividend yield of about 8% and a FAD payout ratio of 80%, the loss of FAD to existing shareholders is 10% of the issued stock value.
It is common to think of dispositions and the subsequent investments as a package, so that one loses some NOI via the disposition and gains back more NOI via the investment. Then the difference in cap rates directly indicates the gain to NOI associated with that cycle of activity. But here we focus on dispositions as part of raising equity and then look for the return on equity. So we need to account for the ratio of FAD to NOI.
Typical dispositions do not impact corporate costs, so the cap rate obtained has to be divided by (FAD/NOI) to find the cost to FAD. A 5% disposition cap rate then implies a 9.2% cost to FAD on the funds raised.
If you listen to a lot of earnings calls, it becomes clear that some CFOs have an understanding of the above, including how the retained cash fits in. Others are more empirical, just running numbers for cases. And some [ahem, Realty Income (O)] expound bad theory.
Overall, then, the weighted average cost of new equity for the historical distribution of sources would run at 8.3% today. This corresponds the red dot on the above plot. They need cash-on-cash returns above 8.7% to avoid losing per share cash earnings.
[A side note here: If Armada Hoffler were to decrease their payout ratio on FAD and raise their retained cash to 30% of their total new equity, reducing the other sources equally, then the weighted average cost would drop to 6.8%. This illustrates the high power of lower payout ratios.]
So how will they invest the cash they raise from the ATM and other methods? Here is CEO Lou Haddad:
Right now, developments don’t pencil, don’t pencil with our cost of capital. That’s why we’re going to be reliant more on the preferred equity and the mezz platform in order to grow the portfolio.
We just saw why developments don’t pencil. This quote supports the notion that Armada Hoffler is not just going to dilute shareholders with a bunch of pointless empire building. And cash-on-cash returns well above 9% are quite feasible today in mezzanine loans and preferred equity investments.
So the message here to those worried investors is this. As always keep paying attention but right now: Chill Out!
Takeaways
As to whether Armada Hoffler management are heroes or villains, put me down for “heroes.”
They do have 40 years experience as a real estate company, and have been successful. But as a public REIT they are still young and stupid heroes. Somehow characters from the Iliad come to mind.
Armada Hoffler has a ways to go to become a blue-chip REIT. They need to do these things:
Reduce their Debt Ratio by a at least a third.
Sustain an FAD payout ratio no larger than 80% and preferably push it down.
Transform their debt types (and reduce operating leverage) until they get investment grade ratings and can place public debt.
Continue to diversify geographically.
Armada Hoffler is today as vulnerable to dividend cuts and dilution as Camden and many other REITs were in 2007. Investing today is in part a gamble that another such severe period is not on the horizon.
Still, the evidence says that they are fully focused on actually growing shareholder value, in contrast to some blue-chip REITs who only pay lip service to the notion. And they seem likely to continue to create mixed-use communities that can drive high occupancy and high rents.
So I will continue to hold this company, but still think it is the riskiest of my REIT holdings. If you do decide to hold AHH, pay attention.
I appreciate the article, and I have no emotional attachment to this one. If the thesis changes, I would like to be quick to pull the plug and redeploy. I think you have done that well in the past. At the highest level, would you say the thesis for AHH is that they should (over time) make progress towards becoming a blue-chip REIT? And if they start doing things which are inconsistent with that goal, then it might be time to bail?
Thanks Paul. Excellent, as always. AHH management appears to think like owners (which they are, of course...and founding owners at that)....that's great. They seem like solid business people. I agree with you that their dividend is too high and have trouble understanding why they recently increased it by 5%. They had a solid quarter but not "lights out". It seemed premature to me. Pausing or increasing it ever so slightly would've made more sense to me.