


Plains All American


Consider a company that cuts their distribution once every four years on average. Would you invest for income?
Plains All American (PAA, PAGP) is a crude-oil-focused, midstream-energy company. Here is the history of their distributions:
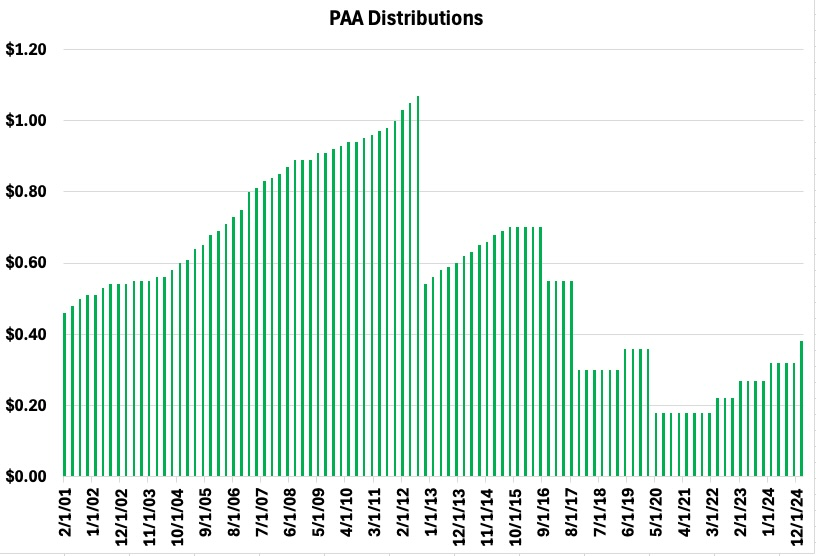
In the 20 years since 2004 they have cut the distribution 4 times, and it is now approaching 5 years since the last cut. From this (rather silly) perspective, it is about time for another cut.
For comparison, this recent article of mine found six major energy midstreams with no cuts in the 20th century, one with one cut, and one [Williams Companies (WMB)] with three. So
Plains wins the award for most distribution cuts by a major midstream in the 21st century.
Yet today there are many boosters of PAA as an investment. And no wonder. Check out the growth of $10k:
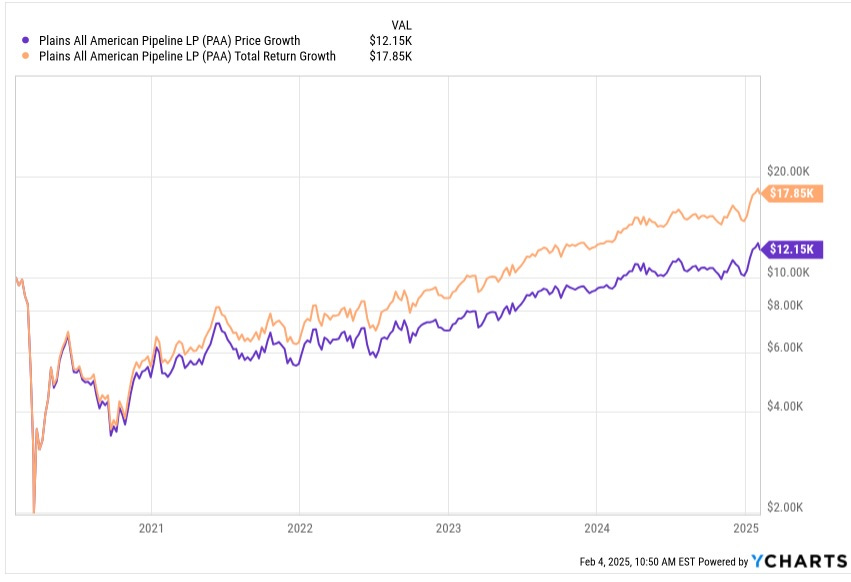
The price has (literally) increased exponentially for 4 years, which shows as a straight ling on on this log plot. The CAGR of price is nearly 20% while that of total return in above 30%.
However, this is a bit misleading. If you compare with other major midstreams, they all plummeted in 2020 and have big gains since then:
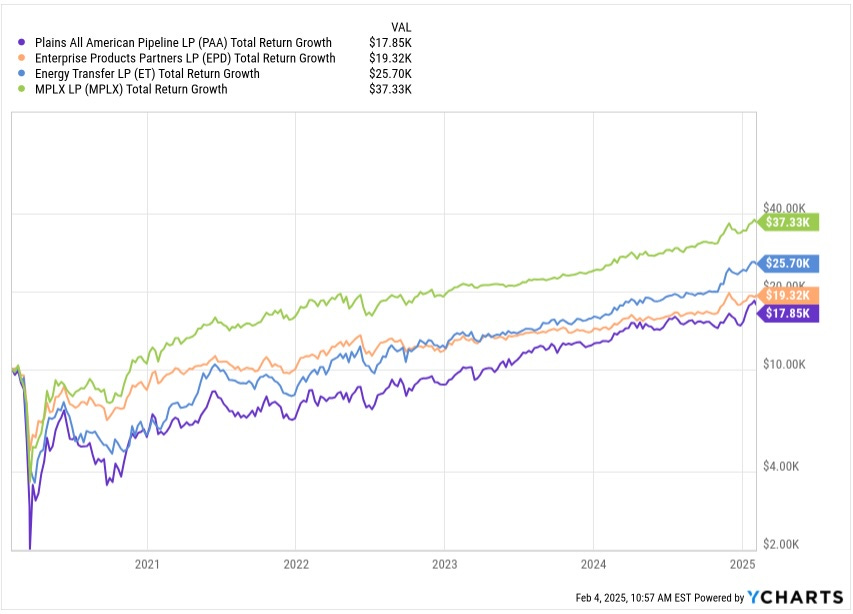
The biggest difference is how far PAA fell during 2020, affected by the associated dividend cut. So if you believed in them then, that would have been a great time to buy. But one should not get fooled thinking the recent past will be the future.
Our goal here is to understand Plains and their prospects. We will get to company-level details in a bit, but first we need to look at a high level for what went wrong in the past.
Flavors of Midstream
The simplicity of the idea of midstream masks complexity that matters. At root midstream is transport, whether of oil, or gas, or some other product.
A company carrying gold or silver from the mines to the markets in the 19th century could be described as a midstream company. But that business could be executed in at least two ways.
One could charge a fee to transport the gold, leaving the mining company with ownership and the opportunity to sell that gold in those end markets. Alternatively, one could buy the gold from the mining company, transport it to market, and seek to sell it for outsized profits in a “marketing” operation. This second path would expose you to market risk.
One sees these same options in the midstream energy markets today. Some firms seek fee-based income for transporting hydrocarbons, ideally backed by Minimum Volume Commitments (MVCs). Others buy the hydrocarbons with the expectation that their clever marketing will produce bigger profits.
Some firms have emphasized fee-based transport as the basis of their business. Kinder Morgan (KMI) is one that has been doing this at least since early 2017. This is the path to having the most secure cash flows.
Keyera (Key:TSX and KEYUF) has taken a mixed route. They have long (since before 2016) reported earnings in three segments, Gathering and Processing (G&P), Liquids Infrastructure, and Marketing. They have based their dividend on the first two and used the third to support growth capex, where they can smooth out its fluctuations.
From their mid-teens transcripts, it would appear that the Plains gang considered themselves to be superior marketers. Well, either they were not or they were unlucky, or both.
From an optimistic outlook on February 8, 2017 came this on May 7:
What we did not anticipate was weakness in our NGL business. First quarter results in [that] segment, however, were meaningfully below expectations. This was due almost totally to our NGL marketing activities.
and then, on August 25 (edited for length):
PAA is currently outside of its targeted credit metrics and distribution level coverage.
We intend to reset PAA's annualized distribution per unit to $1.20 [a 21% decrease].
we plan to complete pending and in-progress asset sales
we intend to fund our expansion capital program with non-convertible, perpetual preferred equity and a portion of the asset sales proceeds.
we will apply retained cash and remaining asset sales proceeds to steadily reduce total debt
This all is pretty much de rigeur for a firm whose overconfidence gets them in trouble. But management did not get replaced. Today the COO from that era is CEO and the CFO is the same.
So my question is whether we should believe that these guys have learned anything. Let’s see.
Plains Falls Mainly on the Plains
Apologies to My Fair Lady but I could not resist. Here is a recent map of the Plains assets, from the 10-K:
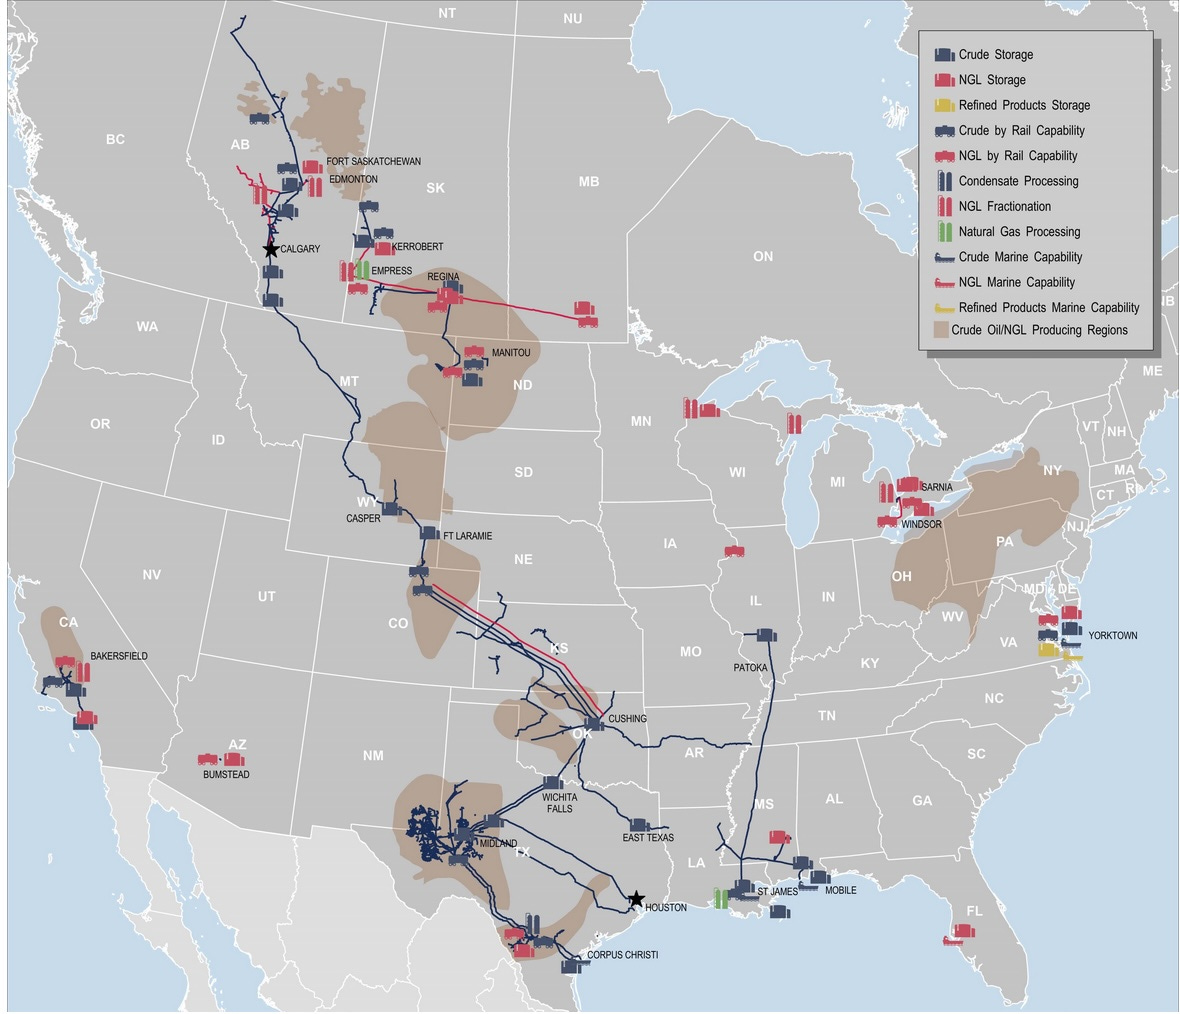
Their crude oil pipelines (dark blue) extend from northern Alberta to southern Texas. They pass through and can gather oil from Western Alberta, the Powder River Basin in Wyoming, the DJ Basin in Colorado, the Mid-Con region in Oklahoma, then they deliver to the major hub in Cushing, Oklahoma.
Also flowing into Cushing from the southwest is oil from the mighty Permian. More about Texas below. One other important asset is the Capline pipeline from the iconic Patoka Illinois to Louisiana, recently reversed so that it now carries Canadian crude oil south for refining or export.
Plains also gets about 15% of their $2.75B EBITDA from NGLs, mostly in Canada. Their assets there complement those of Pembina and Keyera.
Notably, today 40% of their current EBITDA from NGLs is fee-for-service. Of the rest, 90% is hedged. So long as the gas keeps flowing, they look in good shape here.
About half of the Plains EBITDA, though, comes from Texas oil. Here is an expanded view of those assets:
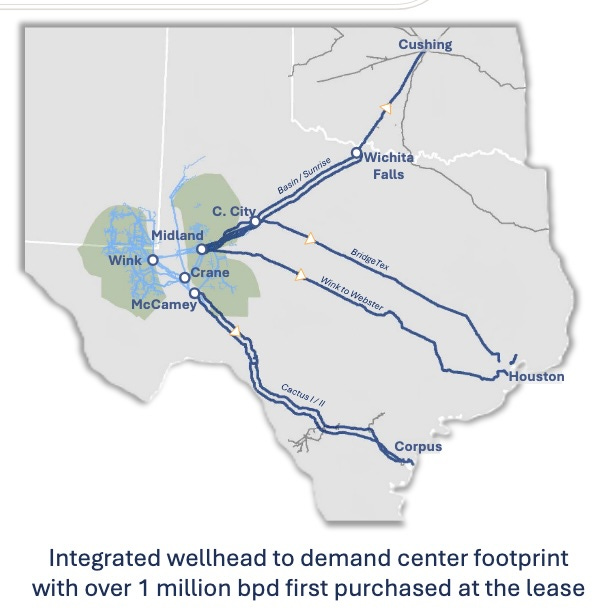
Plains owns interests in 6 pipelines connecting the Permian Basin to the world. These carry oil from the Plains Gathering & Processing assets in the Permian (light blue) and from numerous other producers. They deliver to Corpus Christi in south Texas, the Houston area, and Wichita falls.
As it happened, pipelines to Houston were overbuilt. This led to an informative exchange in the 2021 Q4 earnings call (edited for length and clarity):
Analyst Keith Stanley
[You talk] about 350,000 a day of core year-over-year volume growth as some of the volumes shift to Wink-to-Webster. Are your margins on your existing long-haul pipeline stepping down at all in 2022?
CEO Wilfred Chiang
Well, Keith, I've got 2 comments on that: Wink-to-Webster clearly takes volumes that used to go on our assets and puts it into what I would call durable volumes that have the ability to ramp up. So that's a change between 2021 and 2022. And we're in a very competitive environment. With the reset of production resulting from COVID, the long-haul lines [have had a lot of] surplus capacity. We expect that to continue over the next few years until production starts balancing with capacity.
Keith Stanley
Okay. But I guess I thought you were already kind of running at MVC levels in 2021 on those long-haul pipes.
COO Jeremy Goebel
A few things. One, you're correct, we're at MVC levels. But some of the MVCs to Houston won't get filled as well. It's a mix of pipelines across the industry because there's only a fixed amount of demand in Houston. So you can see that disproportionately impacted as well.
Pipelines to the Gulf Coast [are] largely protected by MVCs, but the spot capacity will represent what the market is. The Wink-to-Webster will be at T&D levels Cactus II and Cactus I, those T&Ds will be in place. [T&D: covering only the cost of transmission and distribution.]
That marginal spot capacity, as Midland and MEH has come in, will be a different tariffs, those incentive tariffs. So that will be one headwind and then maybe a portion on volume. But by and large, we'll compete for barrels across the system and look to fill them as we always have.
In 2022 Plains reported that their long-haul volumes were 1.2 MMB/d out of a capacity of 1.7 MMB/d. After that they quit mentioning capacity on their slides [why?!]. By 2024 the total was up to 1.56 MMB/d, so the period of overcapacity finally appears to be over.
The weighted average contract tenure on these pipes is only 3 years out, in 2028. But it seems likely to me that recontracting will go well.
Plains has a lot more than just their Permian long-haul assets, though. Here is a breakdown by volume of oil transported:
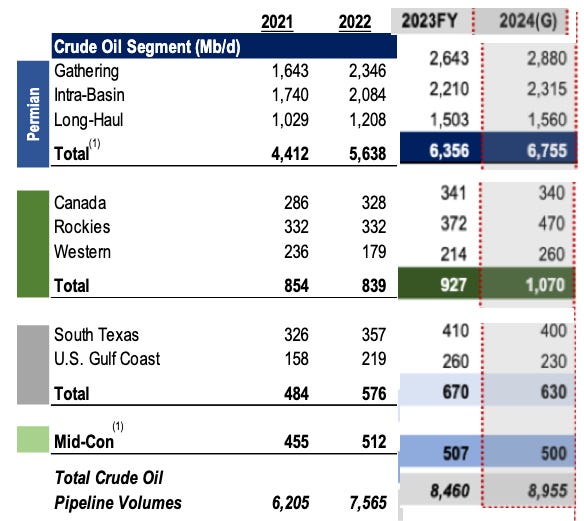
Over the past 3 years, you can see the major (~50%) increases in Permian volumes. This included gathering and intra-basin pipelines, in addition to the long-haul ones. That reflected the growth of Permian production to fill the overbuilt long-hauls.
Volumes also increased from their pipelines north of the Permian, and from South Texas and the US Gulf Coast. The increase was smaller in the US Mid-Continent region, which is no surprise.
Growth and the Cliff
Any company faces choices about how to fund growth and how to talk about it. This in part reflects how easy it is to grow earnings.
If you are certain that new investments will produce high enough ROE, then it can make sense to issue stock and take on debt to expand. In this case the sum of distributions and capex can significantly exceed Cash from Operations, with the difference made up by issuing stock and adding debt. [Here CfO will refer to Cash from Operations less changes in working capital.]
Enbridge (ENB) is running this model. TC Energy (TRP) sometimes does too.
An energy midstream company doing this will likely focus on the payout ratio on Distributable Cash Flow or DCF, where DCF is Cash from Operations less Maintenance Capex. The analog for REITs is Funds Available for Distribution or FAD. If the new investments and the existing business both perform, and if leverage does not get out of hand, then that can be great.
Plains was running this model in the mid-teens. But the business stopped performing. You can see their troubles coming with the drop in CfO across 2015, continuing into 2016. Then in 2016, to raise needed funds, they issued preferred stock at the level of 15% of their long-term debt.
They were in trouble already. This from the Q4 2016 earnings call: “The anticipated improvement in operating performance as well as the execution of our financing plan for 2017 should position PAA for a return to targeted distribution coverage and credit metrics in late 2017.”
It does not appear from summary numbers that things got worse in 2017, but they had already reached a critical stage. So they blamed their problems on weakness in their NGL business (see above). [Dad, I broke my leg because I got hit by a butterfly. Never mind that I was balancing on a basketball on top of the fence.]
In the event they issued substantial new debt, diluted shareholders by 50%, and cut the dividend. The thing is, pretty much the same gang that is driving the truck now drove it off the cliff then.
Talking About Cash Flows
Companies that get burned like this then tend to start talking about Free Cash Flow (FCF), which is CfO less all capex. If their FCF exceeds their distributions, they proclaim themselves to be paragons of virtue.
Plains does this. So does Western Midstream (WES), although Western’s past problems were of a very different nature. For such firms, running FCF positive guarantees limited growth but there is a loophole.
Running FCF less distributions positive, as Plains brags about doing, implies running down debt and/or spending money on acquisitions that may not be counted as “capex.” This does not directly imply anything good or bad about Plains, but does imply that one must look at their cash flows in more detail. We take that up next.
[In contrast to midstreams, in my view an energy E&P firm should focus on FCF. The reason is that their capex is predominantly needed to sustain their level of production. So for them FCF is analogous to FAD for most REITs.]
I prefer to see midstreams focus on Distributable Cash Flow (DCF), which is CfO less maintenance capex. This is a better indicator of FAD for them.]
In this report, 2024 numbers are taken to be LTM from Q3 2023, save for some numbers related to investing and debt, which I adjusted to improve the 2024 estimate. Here are the actual cash flows since 2018:
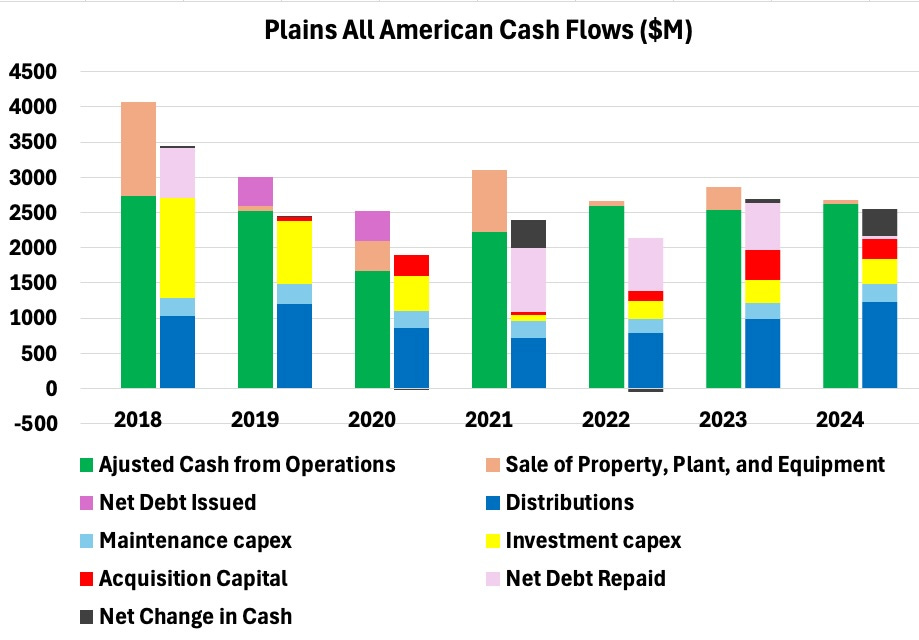
As usual, the left stacked bar shows sources of cash, featuring mainly CfO (green) and sale of assets (tan). After 2020 CfO exceeds the sum of distributions (blue), maintenence capex (light blue), investment capex (yellow), and acquisitions (red).
You can see the DCF coverage by comparing the green bar to the sum of the blue ones. And FCF by looking at the difference between the top of the green and red bars. So they have had large DCF coverage and have been FCF positive, even after acquisitions, after 2020.
And back to 2018 those expenditures have been smaller than CfO plus asset sales. Since 2020 they have paid down substantial debt (light purple). This is all delightfully boring; which is good.
Looking ahead, Plains highlights using bolt-on acquisitions to produce incremental returns. They have been finding opportunities that meet their cash-on-cash return threshold of 13%.
They anticipate keeping this at the level of $300M to $400M annually, as we see on the chart for 2023 and 2024. This should grow EBITDA by about 2%, or $50M per year.
Balance Sheet
During their difficult period, Plains saw their Net Debt/EBITDA get way too high. It is much better now.
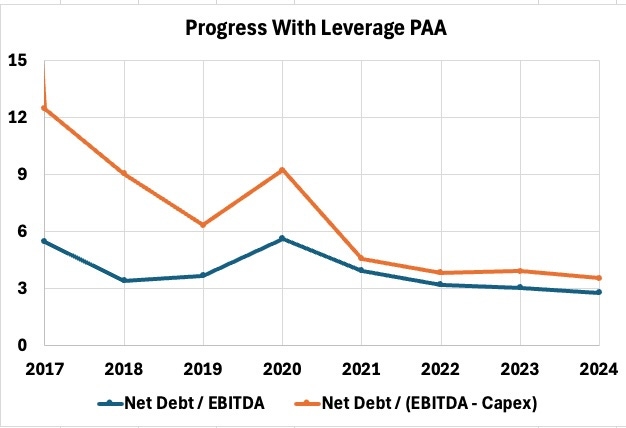
The big change that drove the observed improvement was a reduction of capex. In the teens, a very large fraction of their EBITDA was used for capex. Capex came down strongly after 2020.
After 2017 the debt changed little until being worked down in recent years. EBITDA grew in 2018 but has been fairly flat since.
Today their debt places them among the least leveraged group in the sector. The maturity ladder also looks good:
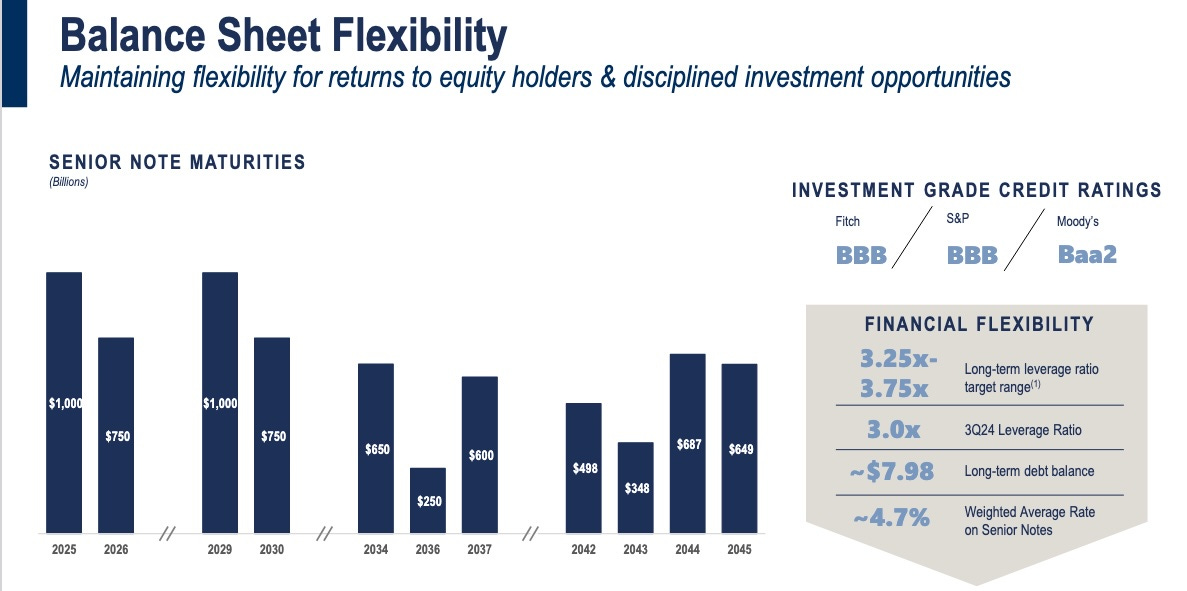
Future annual maturities never exceed 40% of current CfO. Plains today looks very unlikely to again encounter the balance-sheet problems they had in the teens.
This year, on January 15, Plains placed another $1B of 10-year debt, at 6%. You can see that this will slot nicely into the maturity ladder. It will kick up the weighted average rate a bit, which is happening to everybody these days. No concerns there.
Distributions or Dividends?
Their decade of debacles ended in 2020 and since then Plains has been growing their distribution. It reached $1.27/unit in 2024. Current (DCF) coverage is 190%.
Their announced intention is to increase the distribution by $0.15/unit annually until the DCF coverage comes down to 160%. This is growth in the 10% ballpark.
At this rate they would reach their target fraction in about 2 years. But that assumes no growth of DCF.
Beyond that, the gains from reinvestment will support distribution growth in the ballpark of 3% of EBITDA ($0.07/unit or 4.5% in 2027). Additional growth will reflect increases in tolling and other fees. Those carry inflation adjustments.
Plains has also exploited their ownership structure to offer an alternative security to shareholders that issues a 1099 rather than the K-1 issued by PAA. This stock, PAGP, carries an ownership interest in both the GP and PAA (at 25%).
Here is their chart showing some aspects of this. Notably, there is no upstream entity as a GP, with control over the MLP that might be at conflict with shareholder interests.
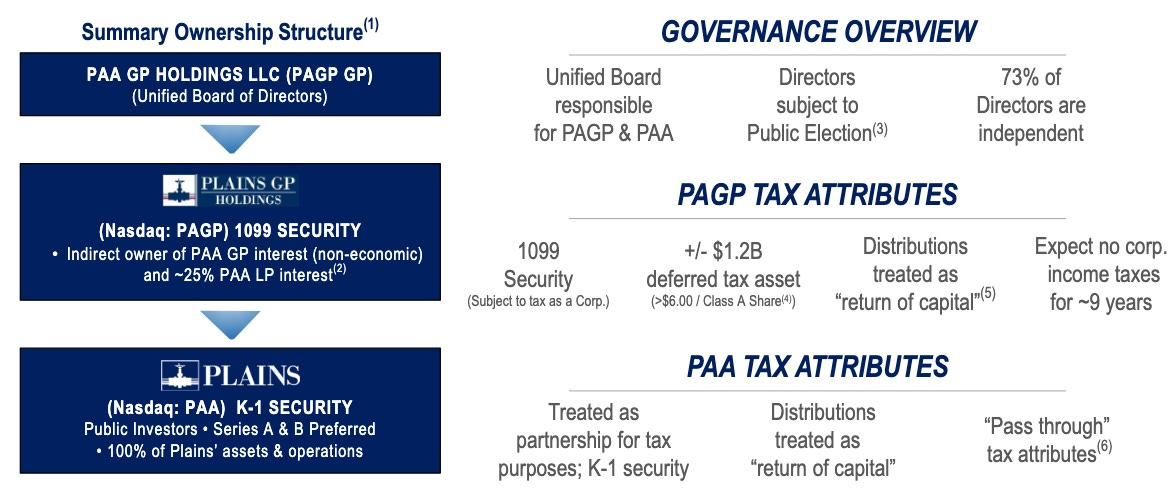
The dividend on PAGP equals the distribution on PAA. So the market gets to decide the relative value of ordinary dividends vs partnership distributions, when both are mostly treated as “return of capital.” The verdict has been “not much difference,” as you can see here:
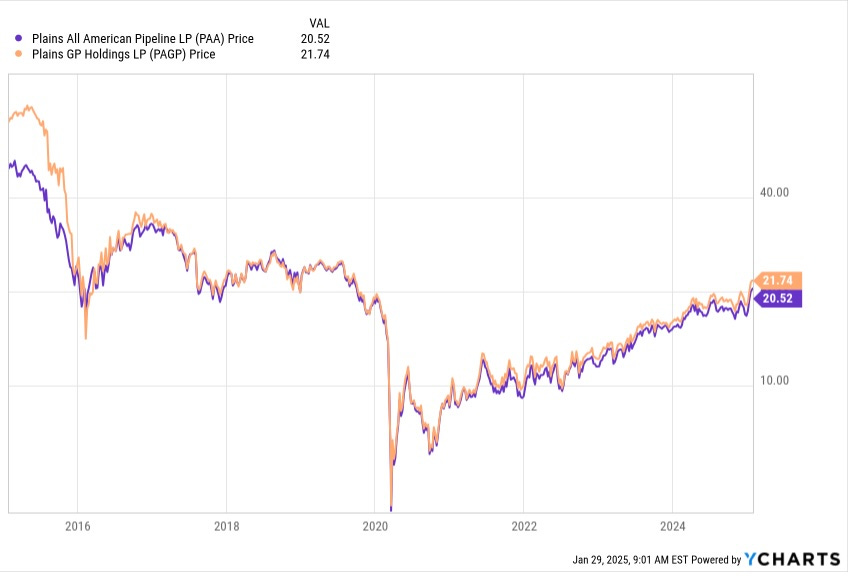
So you get to take your pick, based on your own tax preferences.
Valuation
Two ways to set a value for such a company are to use, as the value produced for shareholders, either distributions or FCF. You get higher valuations using FCF but in reality not all of FCF acts to grow shareholder value.
My calculations all used a 10% discount rate. The present price of PAA would represent fair value for:
35 years of distributions, growing after 2027 at 4%
20 years of FCF, growing after 2027 at 5%
30 years of FCF, growing after 2027 at 3%
One can argue about the right model, but the reality is that the future is uncertain. What I take from these examples is that there no sign of significant undervaluation or overvaluation. On a cash flow basis, PAA now seems fairly priced, more or less.
Turning to comparative valuations, here is what I see in the tabulation by Michael Boyd:
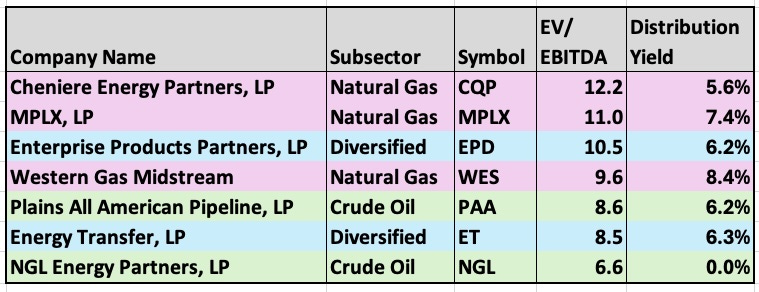
PAA is valued about where Energy Transfer (ET) is. On EV/EBITDA, they both seem to carry a two-turn penalty compared to Enterprise Products Partners (EPD), who is the gold standard.
For PAA this could be a crude-oil discount. Or maybe the market is discounting their past inability to shoot straight.
For ET this is the familiar Kelcy Warren discount. Can one trust ET not to waste shareholder capital by overinvesting? And not to incur severe obstructions or penalties through needless legal and regulatory conflicts? The market seems unsure. I know I am.
Alternatively, income matters for yield investments. If EPD, valued more highly, is still paying 6.2%, then the other two are under-delivering. It will be interesting to see whether the telegraphed distribution increases by PAA also push up their valuation.
[I hold EPD, MPLX, and WES at present.]
Takeaways
So suppose you meet a potential partner and find them attractive. You can see that they are behaving in all the socially expected ways today. But then you learn that a decade ago they did some really stupid things that strongly and negatively impacted their partner at that time.
Do you trust them and start a relationship, or not? This is where I find myself regarding PAA and for that matter also ET.
PAA looks strong at present. Crude oil flows out of the Permian will keep increasing, modestly.
As Arjun Murti argues, global demand will peak in some distant future decade, but one can’t know which. Global demand will be driven by the quest for better lives by those who live in energy poverty today (more than 7B people).
And PAA has been behaving themselves, financially and operationally. So long as they don’t get lured into “build, baby, build,” shareholder returns seem likely to grow.
But I tend to avoid management teams that ever have gotten their company in trouble with debt covenants. To my eyes doing that is evidence of bad management foresight. Specific behaviors may change, but the intellectual flaw remains.
My current MLP positions are as large as I want them to be. So opening either PAA or ET is likely later this year. Which would you choose?
Please click that ♡ button. And please subscribe, restack, and share. Thanks!
Great article as always. I was looking forward to that one. Unfortunately your conclusion was the same as the one I already had, that PAA was rather comparable to ET. Was hoping you would convince me otherwise and one or the other was superior value! 😅 Sticking with my EPD, MPLX, WES and ET for now, but it is worthwhile to monitor the ET vs PAA trend, they sometimes diverge a bit
Debt was big issue 5 years ago.. I believe the PAA debt I own has been upgraded twice since I bought it. I did not know any of the history you described above. Simple 5yr price chart on PAA is remarkable. Sold units twice and bought it back again both times at higher price during that time. I wouldn't hate buying it here but have enough for now. TY Paul