

Sizing a Go-Fishing Portfolio


This will be third winter in which I offer a Go-Fishing Portfolio for dividend income. It is designed with the idea that one could check on it once a year.
There are total-return advocates that have nothing but disdain for this approach. They say that dividends slow the growth of companies and besides can be cut.
Mostly these writers use backward data that extends less than 40 years, and sometimes only 10. So they capture mostly the long-period of declining interest rates after 1982. They miss what happened in multiple periods before that with very different market-pricing dynamics.
That all said, it is true that dividends can be cut. Protection from this is found first in choosing blue-chip companies with investment-grade credit ratings.
But that is not enough. One also should look at the robustness of their income and how well the dividend is protected.
I do that in selecting the portfolio. My previous versions have held only REITs, and I expect to add some energy positions this year. That will also be my focus here.
But still one cannot completely escape dividend cuts. To compensate for them, one should oversize the portfolio (or undersize one’s planned income from it) at the start. Today’s article considers this issue.
Historical Dividend Cuts
To seek an idea of how much loss of income one might see dividend cuts, we look at some history. We start with the very long view, of dividends on the S&P 500, derived from the Stern complilation.
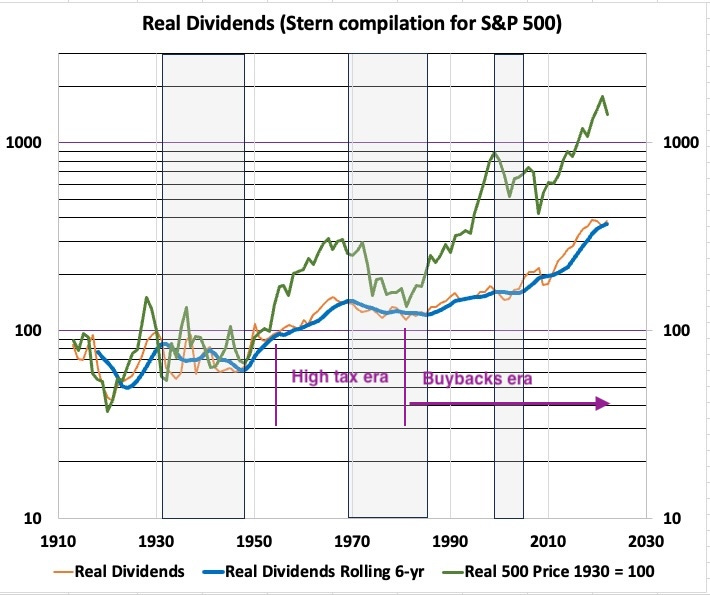
Here you see real dividends (thin orange curve), which were quite variable prior to the 1950s but not so much after that. The blue curve shows rolling, 6-year, real dividends, more relevant to sustaining spending from a well-managed overall portfolio that includes a cushion against short-term variations. The green curve shows the real S&P 500.
There are three eras:
Across the Great Recession and through the late 1940s, real dividends dropped 26% on a rolling 6-year basis. The low of the real S&P 500 was 55% below the 1928 peak.
There was a huge jump in real dividends across the 1950s, but this was also the era of extremely high, marginal, income-tax rates (70% for well-paid professionals and 90% for the really rich). In my view, this fueled a desire to pay taxes on capital gains rather than taxes on dividends.
Then from 1968 through 1982, the real S&P 500 dropped 66%. Real dividends, in contrast, dropped only 13% across the same interval. The economy adapted quite well to price inflation.
In 1982 the laws limiting buybacks changed and since then the majority of so-called “shareholder returns” have been via buybacks. We can note that across the 2000s, the real S&P 500 dropped a maximum of 53% from 1999 to 2008, while real dividends increased 3% from 1999 to 2009.
Because yield matters to support spending from a modest portfolio, and because REITs and energy midstreams support their dividends with long-term cash flows, this is where my investing focus lies. Let’s look at some history there.
We are limited here to the recent past, as both modern REITs and modern midstream companies are creatures of recent decades. Still, most dividend cuts have been triggered by adverse economic periods, specifically the Great Recession and the Pandemic. Such periods seem to have come along once every decade or so throughout the past century, making recent history a plausible way to think about the future.
We also will overestimate the likely rate of lost income, because these companies have in many cases improved their balance sheets in recent years. As one example, Camden Property Trust (CPT) entered the Great Recession with about twice the Debt Ratio they carry today. They ended up cutting the dividend then, but lower-leverage AvalonBay (AVB) did not. In a repeat today Camden would be able to sustain their dividends.
Here are the 8 Go-Fishing REITs from 2024 whose credit ratings are BBB or higher, plus a group of 8 Energy Midstream companies under consideration for inclusion:
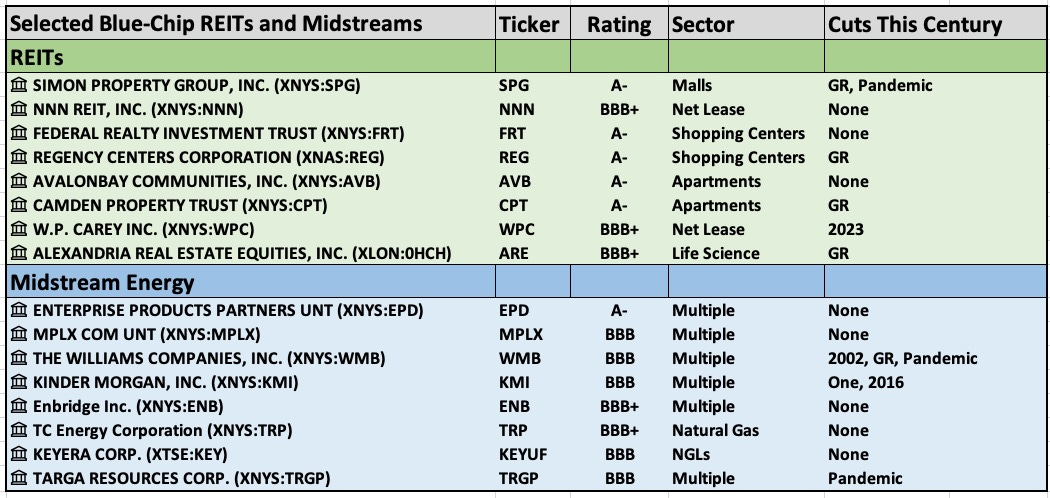
As you can see, there have been 11 dividend cuts, most of which were during the Great Recession. That is over 24 years and so totals 384 company-years. So the cut rate is 2.9% for any one position in any one year.
In contrast, my REIT Go-Fishing portfolio, during its two years of existence, has suffered the one 20% cut by W.P. Carey (WPC) in 2023. That is a 5% rate, which for this group of companies is definitely atypical. I will use that as a worst case. It would correspond, roughly, to 5 cuts per decade across a portfolio of 10 positions.
The reality of dividend cuts has implications. To sustain some specific level of real spending you should start with a larger dividend income and reinvest the difference. We will see below how this plays out.
Looking over the size of the historical cuts, they vary quite a bit. In my model, I let them vary randomly from 10% to 60%, assuming uniform probability across that interval.
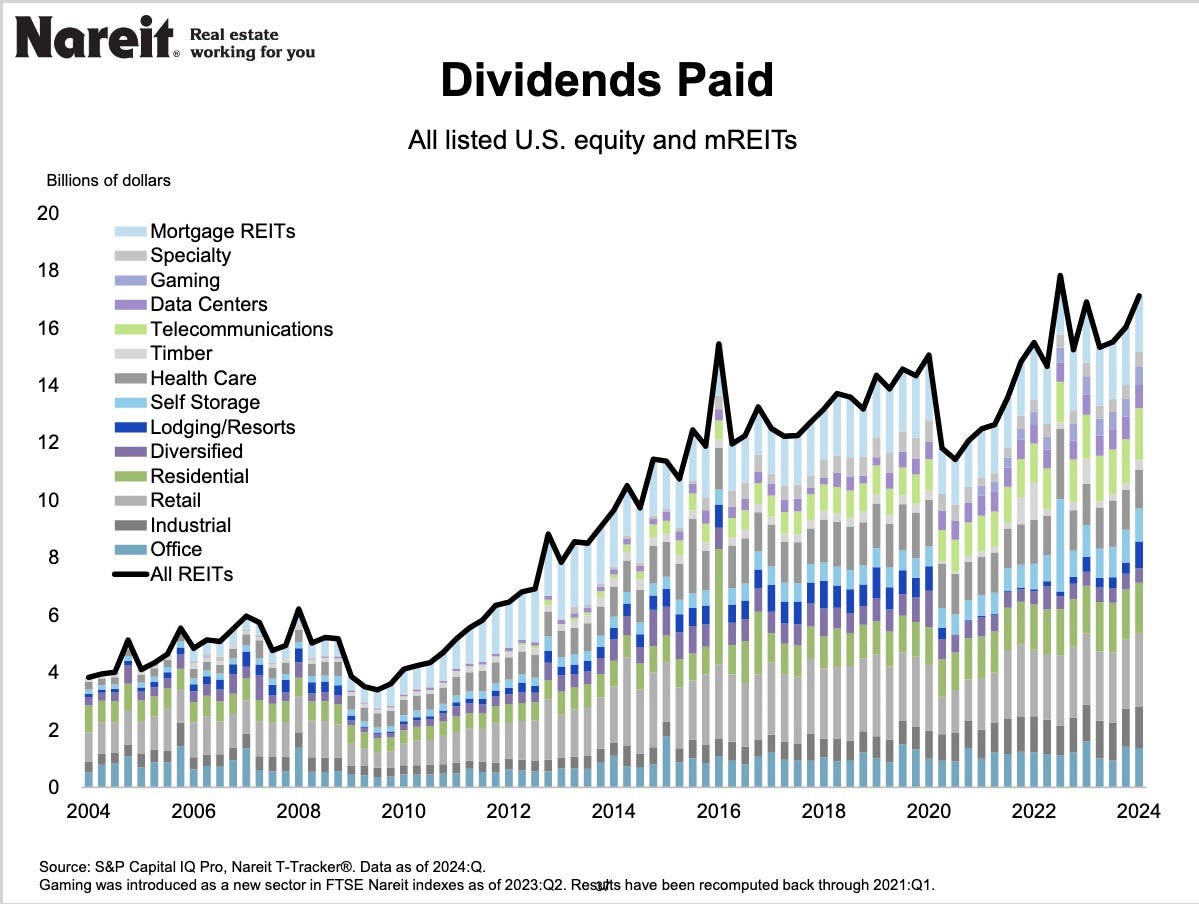
Still for REITs as a whole, look at this plot from NAREIT. Reductions in dividends have been moderate overall, and they have quickly recovered.
Dividend Growth
One can look for companies whose business model theoretically supports growing the dividend faster than inflation. The most secure way of doing so is from retained earnings.
For example, suppose a firm retains and reinvests 30% of Cash from Operations (CfO), which is not uncommon for REITs. If they reinvest that at a 5% return to CfO, which is also not uncommon, this will create an increase in CfO of 1.5%.
So a reasonable expectation is for real CfO growth of small percents. Total growth may be larger, but will mostly be inflationary. (Most of the nominal dividend increases we see result from inflationary revenue increases.)
So what do we see in the historical record for real dividend growth, for our list of 16 companies?
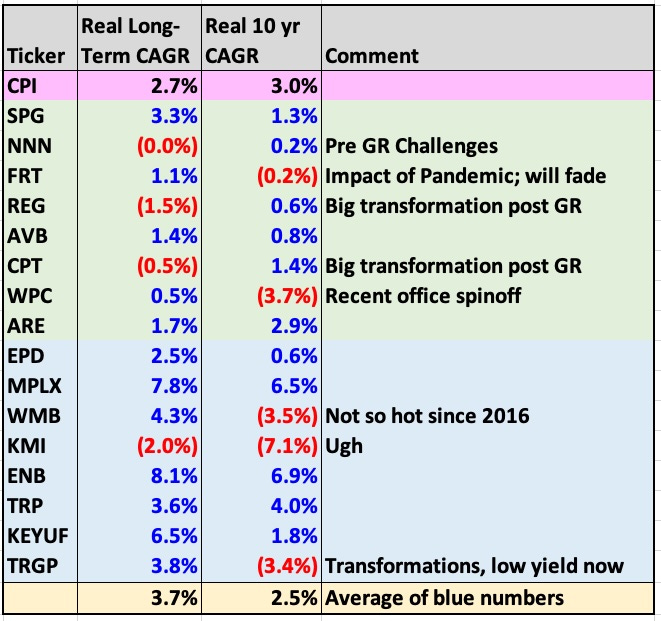
The real CAGR here is found as the nominal CAGR less the CPI CAGR. In most cases, the long-term CAGR is over 22 years.
The approach below models real dividend growth as some number for those firms that do not cut, and evaluates the cuts as described above. The average CAGR of real dividend growth for those that did not cut, over 10 years, is 2.5%, as shown.
Note that the period used includes both the pandemic and the recent spike of inflation. Also note that two midstreams contributed substantially to the average.
Overall, real dividend growth above zero seems likely, but getting 2% is far from certain from firms that meet the Go Fishing requirements.
Modeling Sequences of Income
If you like fancy words, the modeling could be described as Monte Carlo. Here is how it worked:
The initial income was set as some fraction of spending needs, above 100%.
The returns on reinvestment were set at 5%; their impact overall is small.
For each year in one 30-year sequence, the income was reduced or not using random sampling and the probabilistic rate.
When income was reduced, the size of the cut was found from random sampling of the interval from 10% to 60%.
The remainder of the income was increased at a real dividend growth rate.
The resulting, adjusted income became the starting income for the next year. The calculatio continued up to 30 years.
For any set of parameters this was repeated for 20 instantiations.
[I have included an appendix below, for those who need it, on probabilities and sampling.]
The plots below display the 20 curves explicitly for two rates of dividend cuts, as indicated. There was not anything to be gained by doing a gazillion runs and then producing averages and distributions, so I did not.
These calculations ignore the common reality that dividend increases after cuts are often more rapid than the average behavior.
In doing this, selecting the real dividend growth rate is key. Here is the result for 1% real dividend growth, with an initial income of 110% of spending:
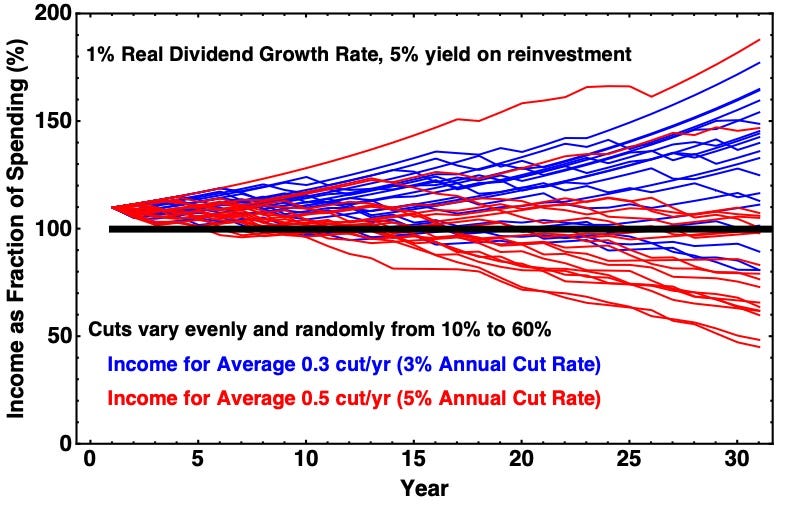
The blue curves are for a cut rate of 3% per year, a bit more than we saw above as a 21st-century average. They show very likely maintenance of the funds for spending, with only about 10% of cases beginning to have a shortfall in a third decade.
The red curves reflect my so-far-experienced cut rate of 5% per year, with one cut overall in two years. You can see that a large fraction of those fall below spending in the second decade. There is an red outlier above all the blue curves, an unlikely case with almost no cuts.
But perhaps this is too optimistic about dividend growth in tough times. Here is the result for 0% real dividend growth. I had to push the initial income up to 130% of spending to get this:
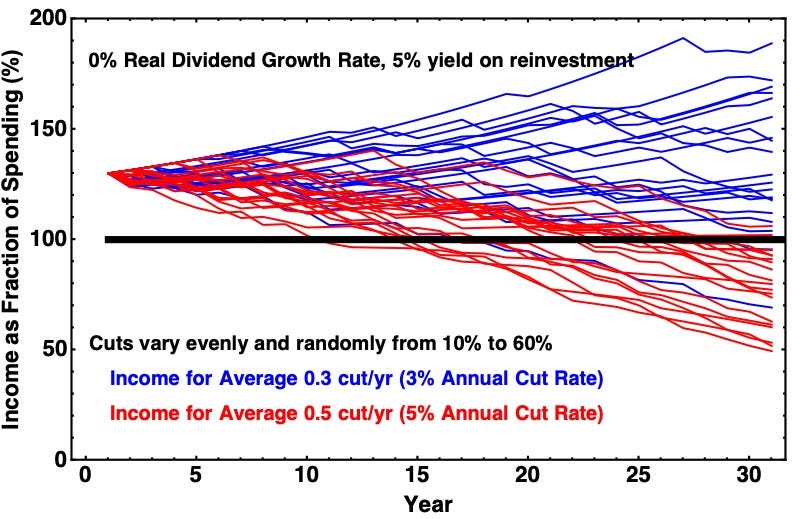
With the change in starting surplus income the results are similar, on average looking very good for the historical cut rate and beginning to fall short in the second decade for the faster one.
Here there is one outlier blue curve near the lower edge of the red ones. That is an unlucky case where dividend cuts come in at far above the historical rate. That leads to a couple comments:
If you found yourself riding that lower blue curve, then it would be time, in 5 to 10 years, to re-examine your assumptions. Firms like those selected should very rarely cut their dividends. If it starts happening repeatedly, then this plan is not working and one should ask why.
The existence of low outliers and possibility of worst cases brings home the importance of diversification. Unless the investments generate income that is far above (say 200% of) spending needs, one probably should have some funds doing something else too.
The exception to number 2 might be if spending is a small enough fraction of the portfolio that portfolio depletion is not a significant concern. In that case the dividends are there to help with inflation and to reduce the possible loss of legacy assets. So one need not worry about the impact of withdrawing funds to make up a possible income shortfall.
Takeaways
The bottom line here is simple. If you become inclined to take a Go-Fishing approach, in order for any reason to become more hands off with portfolio management, set things up to have surplus income at the start.
An optimist might set things up to produce 110% of initial spending. A pessimist might go for 130%. There is not much to be gained by pushing higher than that, because these firms are very well positioned to produce dividends that at minimum keep up with inflation.
Please click that ♡ button. And please subscribe and share. Thanks!
Appendix: Probabilities and Sampling
We deal with probablities every day. We know that there is some chance of a sunny day, say 33% on average in winter in cloudy climes like mine. Likely you know that the broad stock markets go up in two-thirds of years.
Now perhaps you are interested in the variability of cumulative sunny days over 100 days. You can start a spreadsheet and number rows from 1 to 100. Then you can roll a single die and add a sunny day to the toal if one or two dots come up and not otherwise.
This process is called sampling the distribution of probabilities. Each roll of the die gives you one sample.
After 100 rolls you will have one possible pattern of sunny days. If you do another 100 rolls, 19 more times, then you have a total of 2,000 samples in 20 sequences. You can plot the resulting curves on a graph and see the variability produced. The overall average will be near 33% but you will also see variations in consequence of the probabilistic nature of rain.
If you don’t want to work that hard, you can use the random number function in the spreadsheet. These generate random numbers between 0 and 1. Then you can add a sunny day to what was in the cell above if what comes up is less than 0.34, by using something called an “IF” statement. Get that working in one cell and you can copy it to the other 1,999 to generate your full set of sequences in one copy and paste.
Often the probability distribution of interest is more complicated. It might be a bell curve, for example. You can sample that distribution also using a random number generator, after a bit of thought and some math.
What I did above was to sample the two specified probability distributions, both simple in this case. Also, being too lazy to put together the full calculations in Excel, I used a computational math program called Mathematica. The calculation that generated the cases shown above, and can flexibly produce many others, required only 25 lines of code.
Enjoyed the article Paul. Something that came to mind:
- Due to many of the cuts occurring during major economic events it may be more likely that multiple cuts happen at the same time instead of having a constant probability over time.
Paul, the younger folks would say: "Bro, I loved you article, bro!".
Remarks/questions:
- If you were to translate the 110% of initial spending into a cash buffer, how many years should that cash buffer last until those dividend cuts are "ironed out"? Hope this question is clear, otherwise I will re-formulate :) I think I know the answer but want to cross check my understanding.
- Did not see VICI and EPRT in your GF-list above? GF stands for go-fishing, not girlfriend :)
- I must admit that I am a bit "negatively sursprised" by both the ten year and long term real dividend growth. So I defenetley agree and invest by "one probably should have some funds doing something else too." For example SCHD, both passive and incredible dividend growth. I still think its ok to hold some GF REITS for diversification and because its fun :)