


Focused Investing Perspectives #56: Capers with CAPE

What is the meaning of today’s high CAPE values?
We will work our way to the (Shiller) Cyclically Averaged Price-to-Earnings (CAPE) ratio. Start with discussions and advice about investing.
The core of the standard advice, which has worked well in the long run of nearly everyone alive today in the US, is to put money in an index fund based on the S&P 500 and let it sit or add to it. Let’s start with some history of that index:
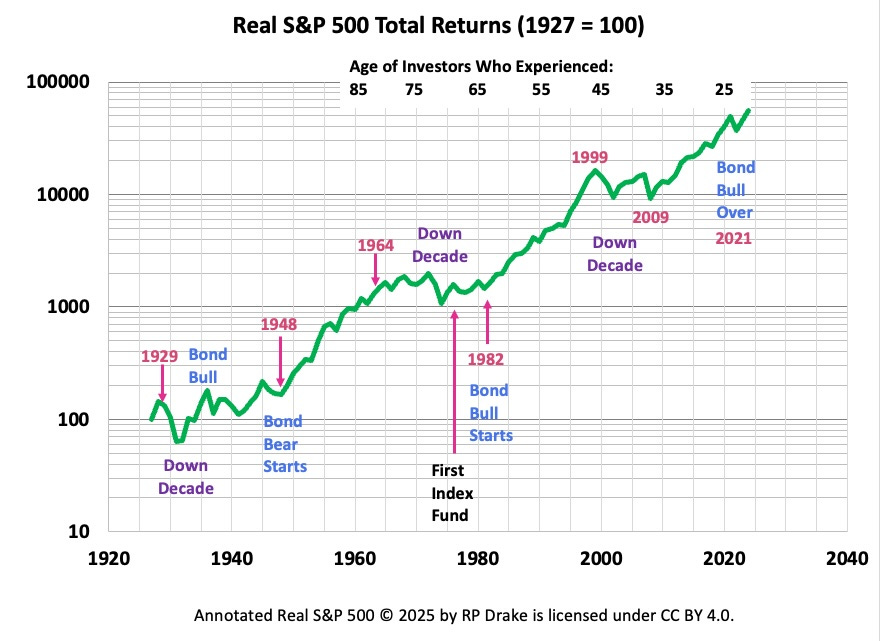
The easy thing to see here is that there is a lot of growth in the long run. But look more closely.
If you retired in 1999, whatever part of your portfoilo you did not spend lost about half its value for a decade, got back to even in 2013, and took until 2019 to double. The Compounded Average Growth Rate (CAGR) of your holdings was 3%. Whatever money you had left and did not spend for the next 5 years doubled again.
The story is similar if you retired in 1965. It took 18 years to get back to even and another 5 to have doubled whatever money was left. Then it took 7 more years to double it again.
If you retired in 1966 and withdrew 4% each year, increasing the amount with inflation, then you hit a low of a 67% loss in 1981 and only got back to even in 1998, just in time for the next crash. (If you held bonds as part of the portfolio then you did worse.)
The story is similar for retiring in 1929.
What seems clear is that you would like some idea of likely future returns. Then you could decide whether it made sense for you to follow that standard advice.
Earnings Multiples
When the mainstream media discusses how highly the market is priced, they usually discuss the P/E ratio of a stock or an index. For the index overall, this is the ratio of the sum of the prices of all stocks in the index to the sum of their current earnings (either forward or backward). There are some wrinkles about prices we will not dig into.
A very high P/E ratio indicates that a stock or the market may be overpriced. The problem with P/E ratios is that earnings fluctuate quite a bit with business cycles. Here is the total of the real earnings of the companies in the S&P 500:
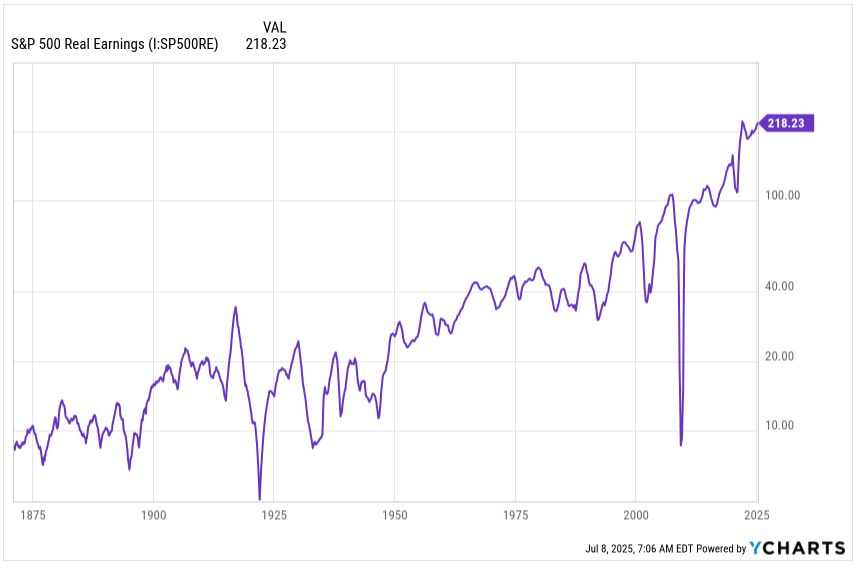
You can see that these earnings change by tens of percents over periods of a few years, and sometimes suffer brief, deep collapses. Prices are typically 10 or more times current earnings, and sometimes much more, and should logically reflect anticipated long-term, average earnings.
In this light, it is more sensible to compare price to the earnings averaged over a business cycle. This is what Professor Robert J. Shiller did with CAPE, using a ten-year backward average of real earnings (and also adjusting for inflation).
His results are available in a spreadsheet here. This is the CAPE ratio since 1870:
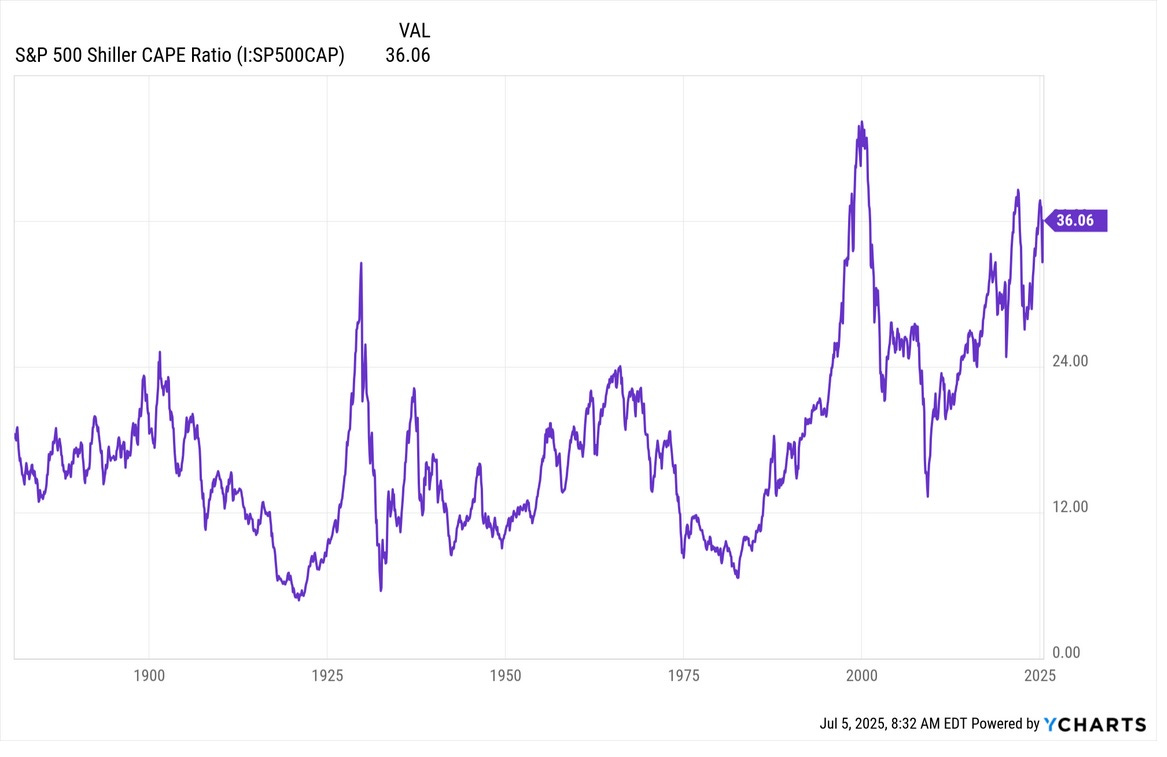
There are still fluctuations, but they are smaller as a fraction. But you can notice that values seem to be higher in this century than in the previous one.
The largest cause of that may be the impact of stock buybacks, which grew prominent after some legal changes in 1982. A company doing significant buybacks causes earnings per share (EPS) to increase.
As a result, a backward average of EPS includes years with smaller and smaller EPS, making the averaged earnings smaller as a sole consequence of the buybacks. The analysis discussed here, for example, found that a company doing extreme buybacks could have a CAPE ratio 50% larger than one doing none.
Here is what you get if you take that literally, and increase CAPE values by 50% prior to 1982:
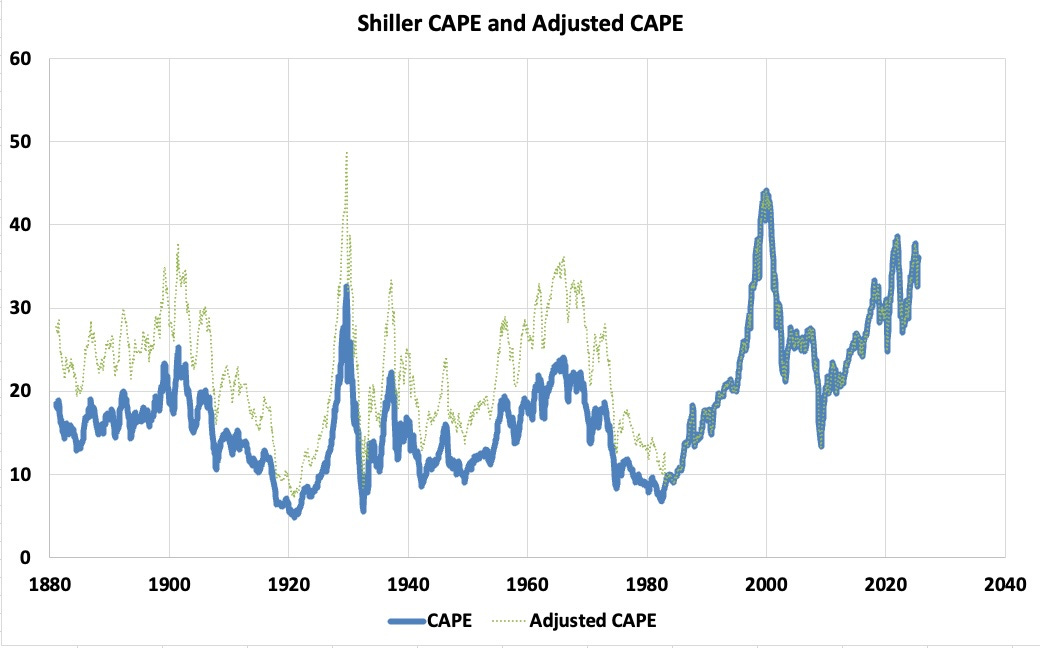
This does look more reasonable, but still the 21st century CAPE values seem somewhat high. Other attempts to correct for buybacks come up with smaller increases.
One contributing factor may be the interest rate suppression by the Federal Reserve, especially since 2008 but even earlier too. This tends to inflate asset values, including stock prices.
There is a cottage industry seeking “better” alternatives for CAPE. Here is one such paper. It finds that buybacks have increased CAPE by 19%.
The problem of finding an ideal replacement for simple CAPE is an ideal academic problem, with the potential for intense arguments over meaningless differences.
There is also a large amount of work concerning how to use CAPE ratios to predict the future. My view is that doing this with precision is hopeless, but that long-term correlations of CAPE and forward returns do provide useful context.
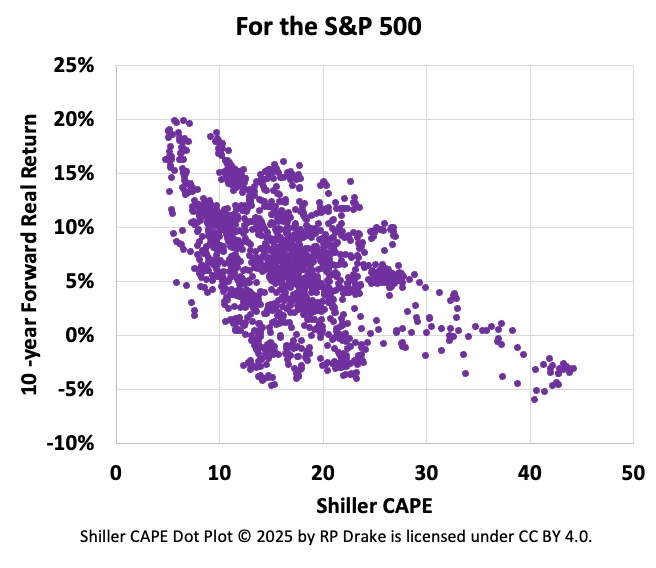
It is now common to see plots showing the value of CAPE for any specific year and the forward real returns of the S&P 500 over some number of years. Here is one I put together, using the Shiller data:
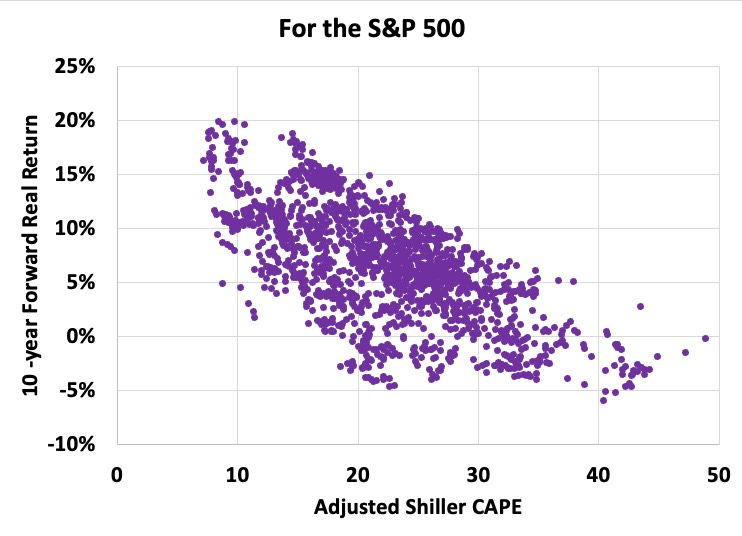
If we use instead the Adjusted CAPE described above, we get one that is a bit cleaner:
These plots show that when CAPE is 20, give or take, the next ten years has produced highly variable returns. These have rarely been negative and have averaged values in the high single digits. In contrast, a CAPE value of 10 or less has always preceded forward, real returns well above zero, with an average near 15%.
But today we are at the opposite end, with CAPE values above 35. In nearly all previous cases, such high CAPE values have preceded a decade with real losses.
Using the adjusted CAPE plot, we have never seen forward real returns of 10% when CAP has been 28 or higher. And there have never been forward real losses when it was 17 or less.
Conclusions and Perspectives
The conclusion here is that today is an unusually bad time to follow the standard advice. While the future is always uncertain, you could see limited gains or even losses over the next decade on any funds invested today in an S&P 500 index fund.
The usual alternative offered by the advisors is to hold bonds, which seems a better choice today than it did before 2022. This is one way to assure positive returns, and if you buy TIPS you can lock in positive real returns. (See my most-recent previous Perspectives.)
My view: the best way to do that is to buy bonds to hold to maturity. Bond funds are not bonds, add risk of loss of principal, and are unlikely in my view to perform as well. If you decide you want to buy bonds, Fidelity and other brokerages can help you do this.
But also consider dividend paying companies that own hard assets, which is my emphasis here at Focused Investing. Dividends have always held up better than prices during those down decades reviewed above.
A focused portfolio can do much better than the S&P 500 during some intervals. Consider this collection of dividend payers across the decade following 1999:
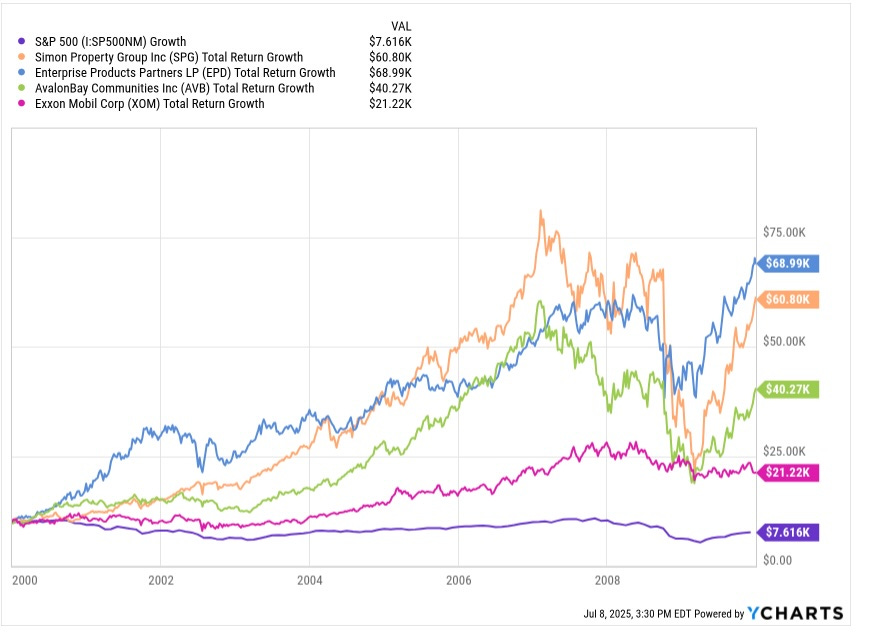
Even stodgy old Exxon Mobil (XOM) doubled your money, for a 7% gain. Multifamily REIT Camden Property Trust (CPT), not shown, nearly tripled it despite getting themselves in some trouble. Midstream energy firm Enterprise Products Partners (EPD) increased your investment nearly 7x. [I own CPT and EPD at present.]
Mall REIT Simon Property Group (SPG) and Multifamily REIT AvalonBay (AVB) were in between, as you can see. Meanwhile from holding the S&P 500 you would have been down 25% in total return, a rate of -3%.
For the next decade from here, you could, and likely would, do a lot better than the S&P 500 with a collection of the firms just mentioned. Realize, though, that nothing is guaranteed.
Without the interest-rate tailwinds of the 2000s total gains seem likely to be smaller than the ones seen above. Still, my money, literally, says that by owning such companies you will do a lot better than the by owning the S&P 500.
Member News
Looking Ahead
Back from my holiday break, I will put out some articles and notes based on topics that caught my fancy. One thing I am working on is a forward-looking overview on midstream energy firms. My recent, similar look at REITs seemed to be appreciated.
With present times being not-so-hot for investing in REITs for upside, my portfolio has become much more heavily weighted toward energy. I know from the chat room that this is true of some subscribers too.
While I won’t be able to resist probing various REITs, it seems clear that energy investments should become more of a priority. That is my present plan for the rest of the year, unless dramatic market changes take me elsewhere.
Personal Notes
A friend noted that I had dropped this section, which was an accident. So now, thanks to him, it is back.
Summer brings a great deal of beauty to Northern Michigan, along with (unfortunately) too much heat for me and bad air when Canada burns. I focus on the beauty.
My break was good and bad. I got a lot fewer chores done than I had hoped. But I got a lot more research done on things that caught my interest.
I also finished the book Challenger, by Adam Higgenbothom. It covers NASA from the beginning through the Challenger disaster and its aftermath. For me it was an emotional experience. In my big lab days, I knew a lot of managers who would also have made the decisions that killed those people.
My July routine includes paying a lot of attention to the Tour de France, now near the end of week 1. We have already seen some exciting racing. The TV coverage of this event is excellent.
More coming!
Recently published material
Material in the past month has included the following 13 items. You can see it all, and search it, at https://focusedinvesting.substack.com/
Recently:
A broad analytic piece, Looking Ahead for REITs
Deep dives with no paywall on Kite Realty Group and Equity LifeStyle
Four Brief Notes
On macroeconomics, and on Canadian REITs, and on a dissonant aspect of coverage of CRE, to all subscribers.
On some price action and on Orion Properties, to paid subscribers
Three Trade Alerts, exclusive to paid members.
A monthly update, with a preview
Paid members also have access to the Focused Investing Chat.
Other Resources
To find my past articles covering a given company, go to the Focused Investing home page. There is a search function to help look for past articles. Search by name or ticker.
A note on my approach to restricting access: Anything providing details of my trades and portfolio is restricted to paid subscribers, as is anything I consider to be immediately actionable. Most articles with information it seems members may act on have a preview section followed by a paid section where the real meat is.
The Google Sheets (for annual members):
The main attraction on the Google sheet is full disclosure of my live, real-time portfolio. If you are an annual paid member and do not have access, please contact me.
There are in addition a REIT assessment sheet, some data from NAREIT’s REITWatch, and a Midstreams assessment sheet, each a tab. And if you scroll down on the Current Portfolio tab, you can see limit orders, some tickers I track, and some playing with possible portfolios.
Also:
Paid members can also post items of interest on the Focused Investing Chat, which I do often. Check it out and post your own items, please. Comments and questions are always welcome.
It can be challenging to search the chat (for paid members only) or to find past articles on mobile devices. To do so, you have to get into the chat so my picture is on the top left, and then punch my nose with your finger (ouch?). You will see a display with a search emoji and a link to the home page where you can search.
Please click that ♡ button. And please subscribe and share. Thanks!
I'm really looking forward to your deep dive on midstream. My working assumption is that "drill baby drill" will not produce the production increase Trump hopes for, but it will hold oil prices down (world events could change that in a heart beat of course). But that also means increased production, be it small or large, and the pipeline companies ought to wind up running at capacity = more dividends.
Appreciate your views on S&P index funds, they align with my own. But not all index funds are built equally. I own SMH, which is a collection of semi-conductor companies. 10 year total return of SMH is 1,120% versus the SP500's 195% (source Seeking Alpha). To my surprised (and concern) the 10 year total return of AMLP, a basket of midstreams that issue K-1's, is only 47.91%. Ouch. SMH is my largest holding (yaaay!) and AMLP is my second largest (gulp). Plus PAGP is 4th. So I have a lot of midstream. I've been saying I'm energy heavy, but if I break midstream out of the number I'm really midstream heavy.
Challenger disaster - I've read various articles on what happened and it is truly stomach churning. Some of the Morton Thiokol engineers who got the initial blame toured engineering universities across Canada and the US to talk about what happened. Their message to the engineering students was pretty simple. Express your concerns bluntly, concisely, in emails and make CERTAIN you've retained copies of those emails. In the end, Morton Thiokol engineers knew the seals would fail at the temperatures that day, but by the time their messages went through many layers of management, they morphed into "its a nice day, launch".
Anyone who has worked for a large organization has seen this in action. I don't know who the author of the following is, but they nailed it:
In the beginning, there was a plan, and then came the assumptions,
And the assumptions were without form, and the plan without substance,
And the darkness was upon the face of the workers,
And they spoke among themselves saying,
“It is a crock of shit and it stinks.”
And the workers went unto their Supervisors and said,
“It is a pile of dung, and we cannot live with the smell.”
And the Supervisors went unto their Managers saying,
“It is a container of excrement, and it is very strong,
Such that none may abide by it.”
And the Managers went unto their Directors saying,
“It is a vessel of fertilizer, and none may abide by its strength.”
And the Directors spoke among themselves saying to one another,
“It contains that which aids plant growth, and it is very strong.”
And the Directors went to the Vice Presidents saying unto them,
“It promotes growth, and it is very powerful.”
And the Vice Presidents went to the President, saying unto him,
“This new plan will actively promote the growth and vigor
Of the company with very powerful effects.”
And the President looked upon the Plan
And saw that it was good,
And the Plan became Policy.
And this, my friend, is how shit happens.
Passive index buying is price insensitive and can lead to overvaluation. Costco is a great company but is it really worth 50 times earnings? Their warehouses are so crowded and traffic reaching them has worsened so future growth will be lower.
The challenge for younger investors like me is that our workplace 401k plans have limited options, and half of the 32 options in my 401k plan are bond funds or target date funds that are just variations on the S&P 500 and bonds. Thankfully I rolled over all prior 401ks to a Roth IRA with more options.
REG retested the January low yesterday and I picked up some shares. NYC is 12% of rent so Mamdani's proposal to create government grocery stores could be driving the selloff along with the decline in TLT (30 year bond prices).
I wonder if investors who were burned by the REIT selloff during the GFC and Covid are worried about a repeat? As you point out, most public REITs have lower leverage now and have been able to roll part of their debt so the "maturity wall" of refinancing is less of a concern for them and instead a manageable headwind of future higher interest costs.
While the recent tax bill will increase future deficits and provide a headwind for REITs, it did make the Section 199a deduction permanent: https://www.dlapiper.com/en/insights/publications/2025/07/one-big-beautiful-bill-act-reit
REITs held in taxable accounts benefit from Section 199a deductions even for investors who take the standard deduction. (I verified this on my 2024 tax return line 13 "Qualified business income deduction from Form 8995 or Form 8995-A" exactly matches the $830 amount that is the result of the 20% deduction of $4,151 in qualified REIT dividends my taxable account received last year.)
Energy stocks have rebounded strongly since the April lows whereas many REITs are back at the January lows and near the April lows. EPR appears to be trading more on AMC's rebound than on the general REIT sector.