


Equity LifeStyle


After a flat 6 years, is it finally time to buy this REIT stock?
It has been some years since I last looked closely at Equity LifeStyle (ELS), a REIT focused mainly on manufactured housing. The main reason for ignoring them has been their low dividend. Even today it is only just over 3%.
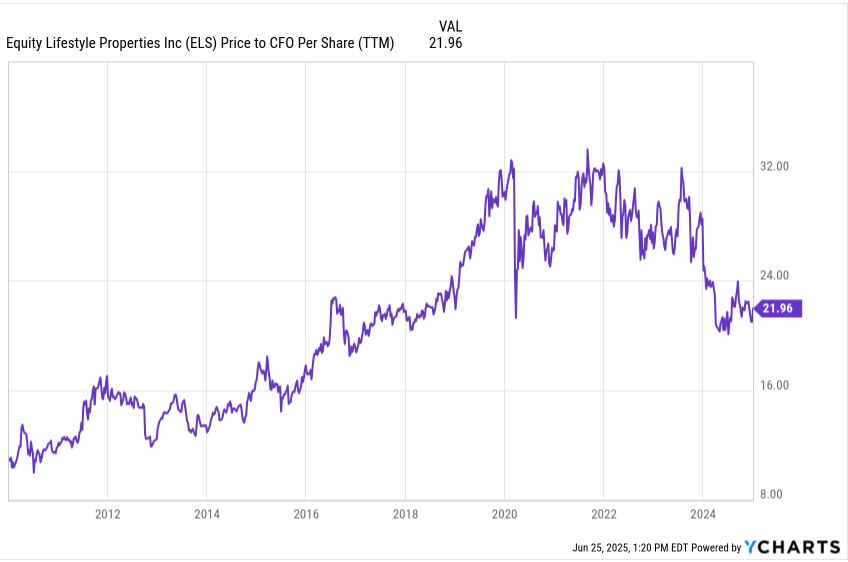
But since 2021 the stock price is off by a quarter, even as CfO/sh has increased by 20%. [CfO is Cash from Operations.] Over the past 6 years the stock price is flat and CfO/sh has increased 30%:
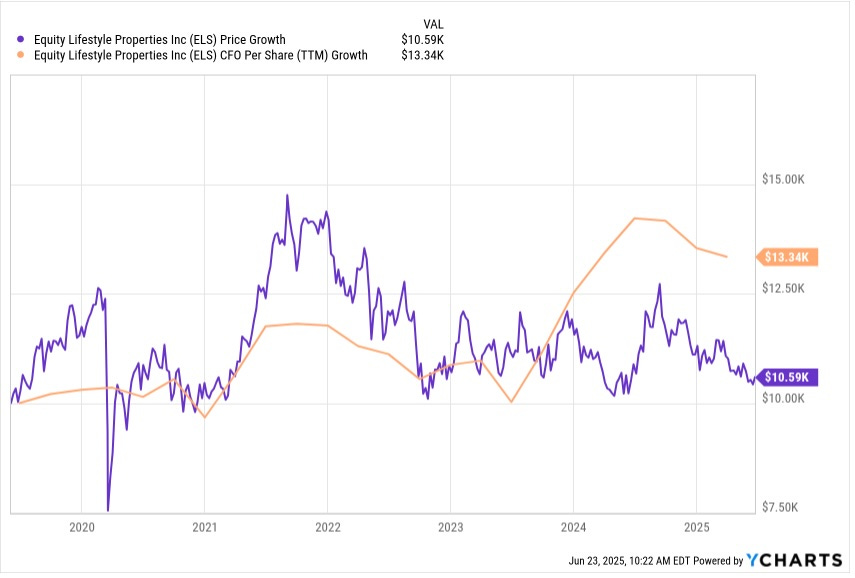
The ratio of Price to CfO/sh has fallen by a quarter over those 6 years. The analyst Net Asset Value (per TIKR) is down nearly 10% while mobile home prices (per Google) are down a bit more than 10%.
Looking aroud, it is unclear to me how much the average cap rates for manufactured homes may have changed. It is apparent that many sellers are not willing to lower prices enough to clear the market.
So perhaps ELS has some upside. But we can already tell that this will not be huge. Let’s see if it is small tens of percents, or not.
Some History
Equity LifeStyle formed as a REIT in 1993, under the leadership of the famous Sam Zell. The history of their dividend yield is striking:
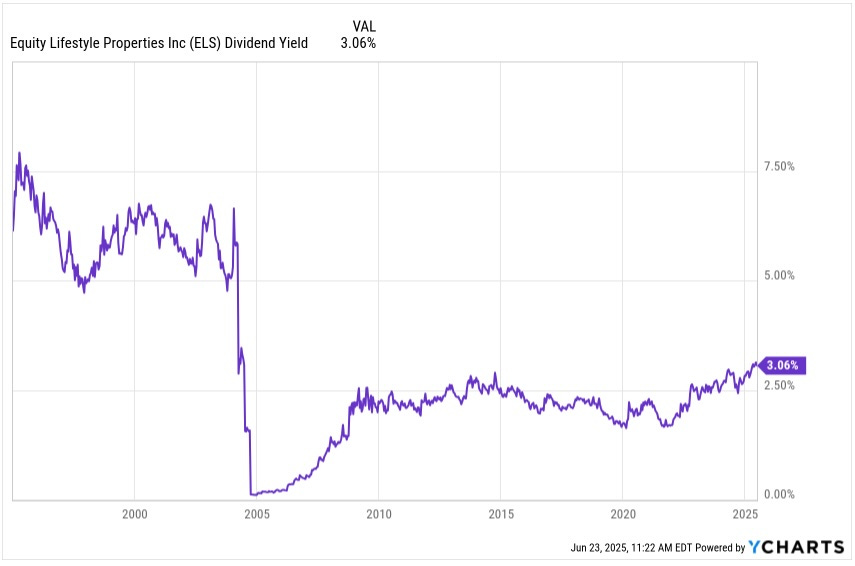
Through 2003 they paid a dividend yield above 5%, even then lower than many REITs did. But then in early 2004 they paid a huge special dividend (not shown), moved all the assets into a new REIT, and started paying a dividend that was less than 3% of the previous one. I proved unable to find much of the story about that transition.
The result, though, was a low dividend that they could grow rapidly, which they began to do immediately. The yield rose through the Great Recession, settling near 2.5% from 2009 to 2022.
Unsurprisingly, the stock price plummeted from 2007 through 2009. Remarkably, though, CfO/sh did not:
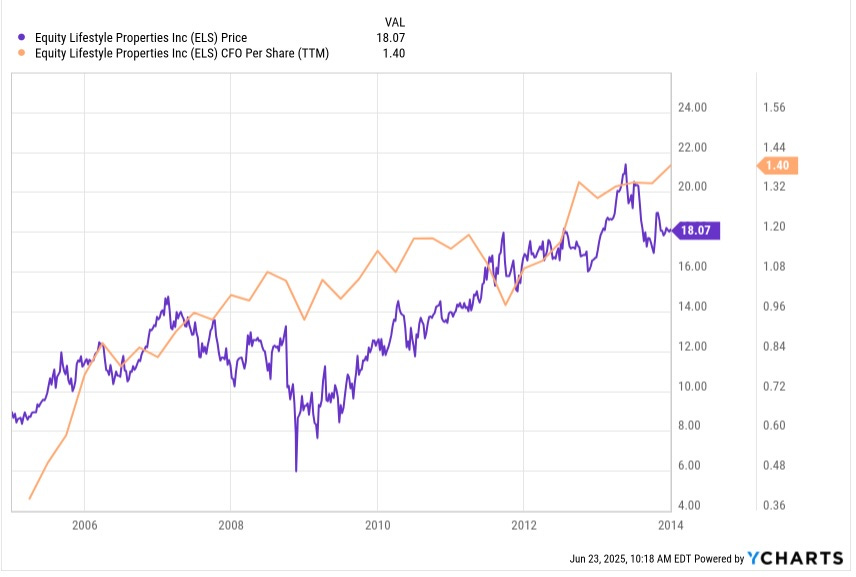
Subsequently, both the stock price and CfO/sh increased rapidly from 2009 through 2019, with a modest fluctuations. On net, ELS was one of the big winners of the 2010s, gaining 7x for a CAGR of total return of 21%.
By 2019, numerous authors were telling investors that the best path to wealth was to buy ELS or similar REITs with low yields and high growth rates. That advice obviously did not age well.
[Many figures below are from the current Investor Presentation.]
Balance Sheet
Before we get into granular details, this is a good time to consider the balance sheet for Equity LifeStyle. The debt maturity ladder is quite good. Here is the next 10 years:
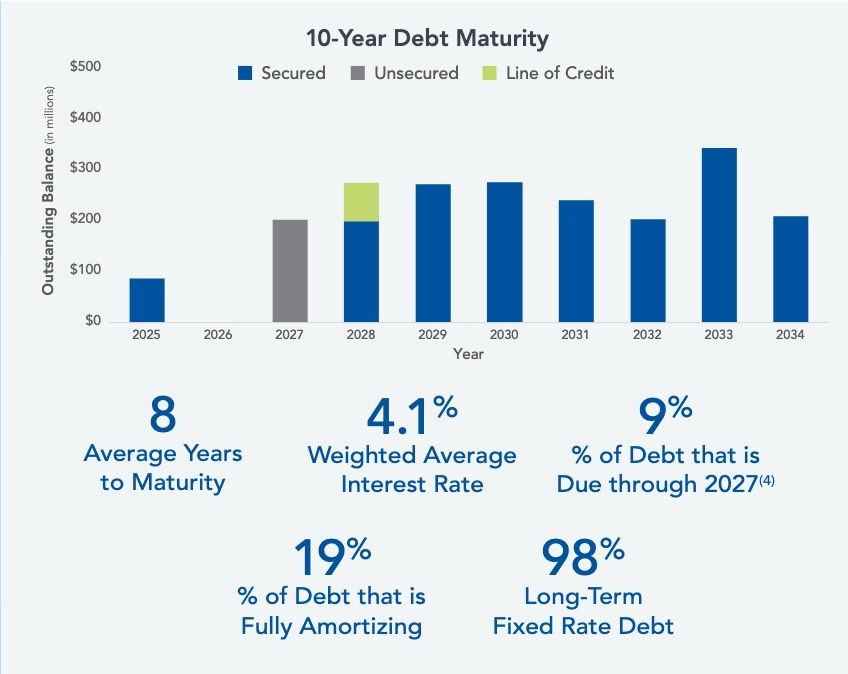
Plus there is roughly another $1M due after 2034, not shown here. Several aspects of this are encouraging:
Having 8 average years to maturity is above average for a REIT today.
Having negligible debt due until early 2027 removes short-term pressure
Having a high fraction of Fixed Rate Debt insulates a REIT from short-term interest-rate changes.
Their secured debt encumbers only 120 properties, less than a third of their total.
The typical annual maturity of $250M is less than half of CfO.
The unique thing here is that Equity LifeStyle has almost entirely secured debt. Most REITs cannot access mortgages with long maturities. For political reasons, Equity LifeStyle can access long-maturity mortgages through programs developed by the Federal Housing Finance Agency.
The credit agencies do not like secured debt, though. As best I can tell, Equity LifeStyle is not rated (and Yahoo Finance has this wrong).
If you look at the balance sheet you see that total Long-Term Debt runs near 40% of Gross Assets in recent years. This is higher than I see as optimum for anything but a triple-net-lease REIT, as is discussed here.
Even so, those long maturities at fixed rate make holding that much debt less risky. They imply that it would take a long time for interest expenses to normalize, even if long rates do stay high.
Refinancing that annual maturing $250M of debt, from 4% to 6%, would cost an incremental $5M, which is less than 1% of CfO. This is a bit better than most REITs today; it would be an impediment to growth and not a source of structural problems.
Categories, Rent, and NOI
Over the years Equity LifeStyle expanded from Manufactured Housing (MH) properties to add RV sites and Marina slips. Here are the summaries at year-end 2024 and year end 2013, from their Supplementals:
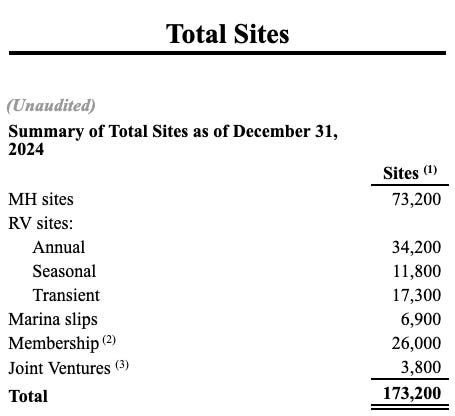
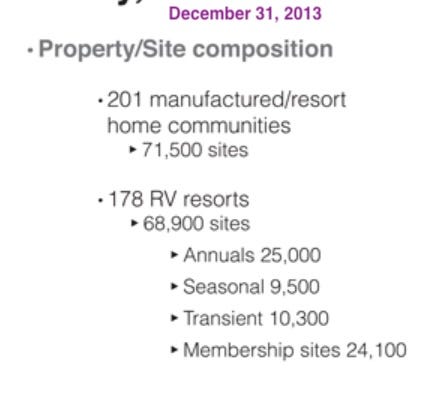
Across this interval, Equity LifeStyle added an average of nearly 3,000 sites per year. This was a CAGR of about 2%.
However, only 150 of those were MH sites, on average. Most of the additions were RV sites.
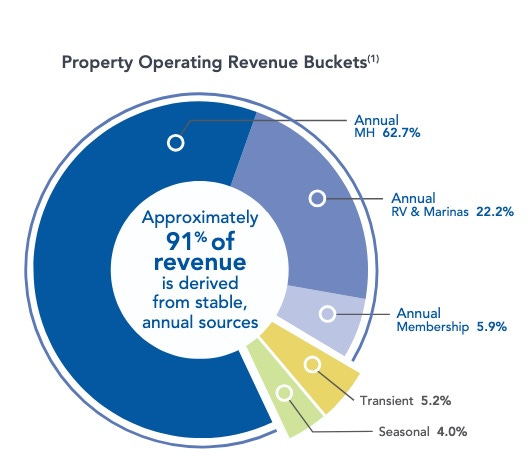
Today they have more RV sites than MH sites. But the MH sites still dominate their revenue:
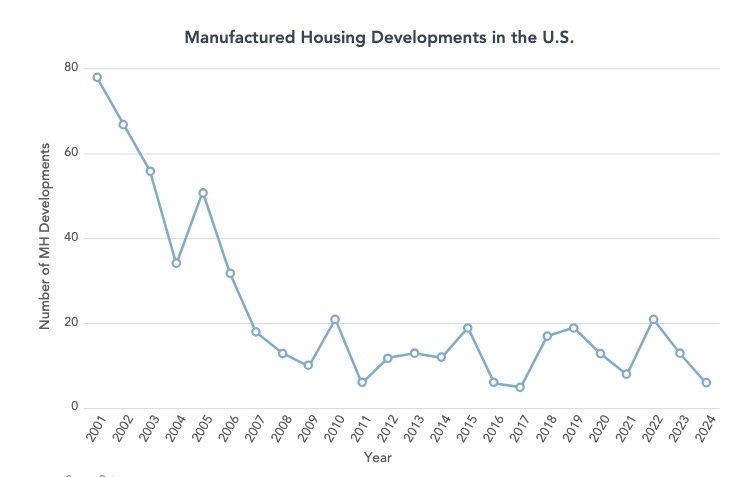
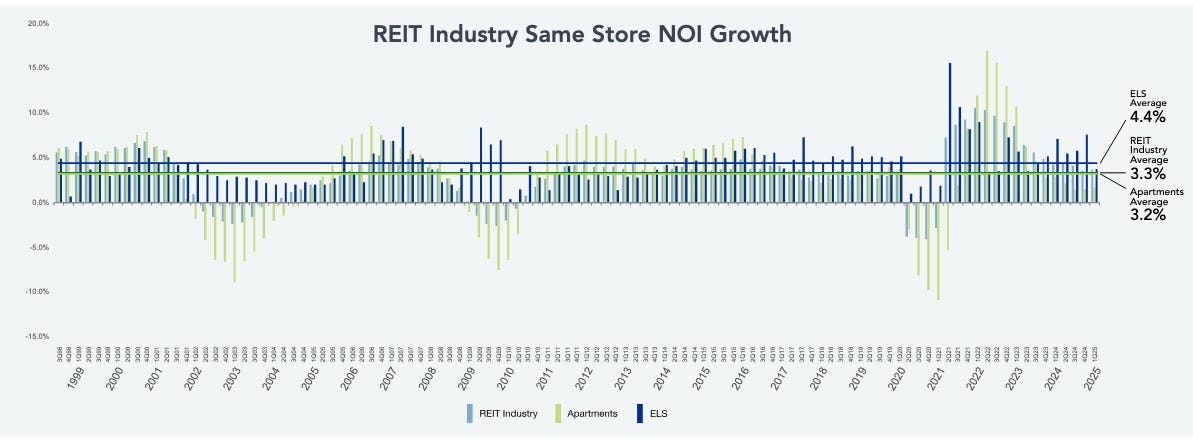
So when we look at metrics such as same-store NOI growth, this is dominated by the MH numbers. Remarkably, ELS has sustained such growth at rates above inflation, as you can see here:
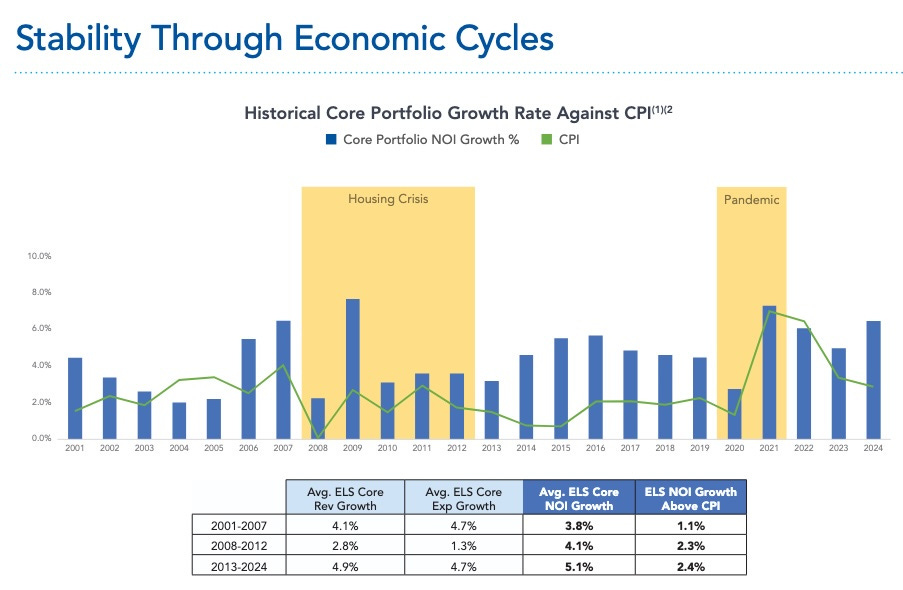
At least two factors have made this possible. One is limited supply:
The other is that rents remain low compared to other options. The average MH site rent is still below $5k/year. If you put a $100k, two-bedroom home on the site with an $80k mortgage, the mortgage payments even today will be below $6k/yr.
In most US markets, finding a two-bedroom apartment at $1k/mo is tough. This comparison is what has enabled Equity LifeStyle to push MH rents for 20 years. The result:
Today, in real terms rents cannot increase a lot from here relative to those of apartments. But maintaining an average differential of 1.2% in rents (not NOI) for a decade would only produce a 22% difference in the relative rents. So while there must be a limit somewhere, we may not see it anytime soon.
In addition to the income from property opereations (the revenue distribution is summarized above), Equity LifeStyle nets about $40M from “home sales, brokered resales, and ancillary services.” This is small enough to ignore.
What is not small enough to ignore is their capital expenditures. These average above $250M per year (out of <$600M of adjusted CfO). Equity LifeStyle breaks this down as follows:
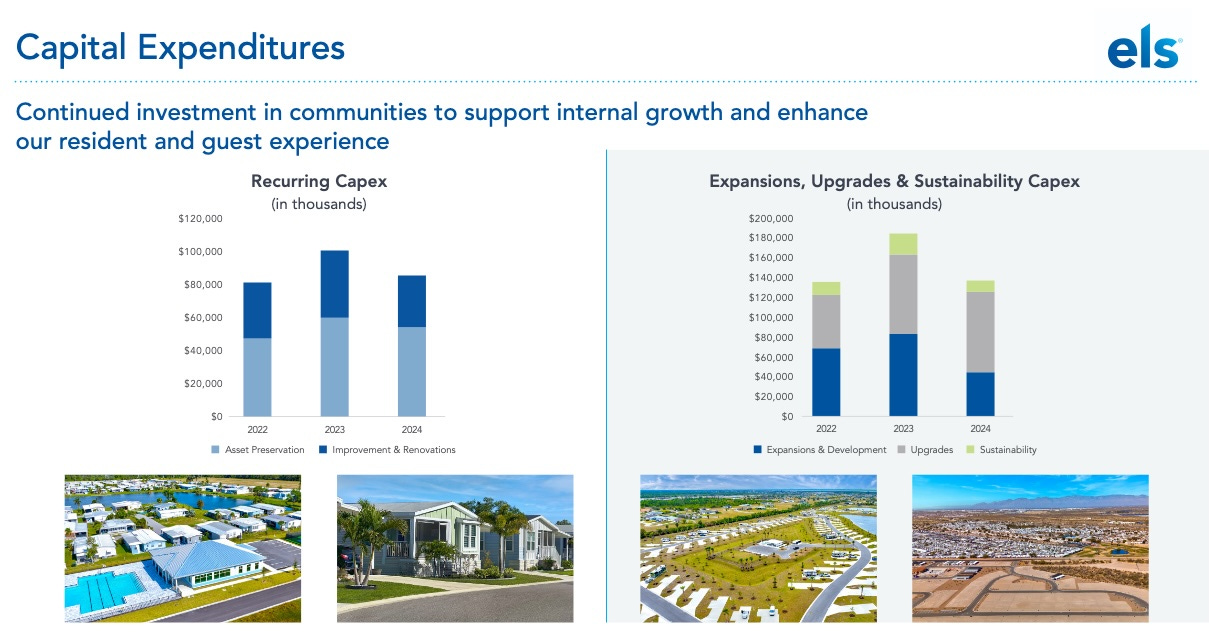
About 40% of that capex is “recurring,” so roughly $150M/yr is growth capex. If that were invested at an 8% yield to NOI or 10% to CfO, it would grow CfO by $15M or about 2.5%. Add this to the strong rent growth discussed above, and you make sense of the strong growth of NOI overall.
Cash Flows and Earnings Measures
What is really remarkable about Equity LifeStyle is their growth model. Look first at the cash flows:
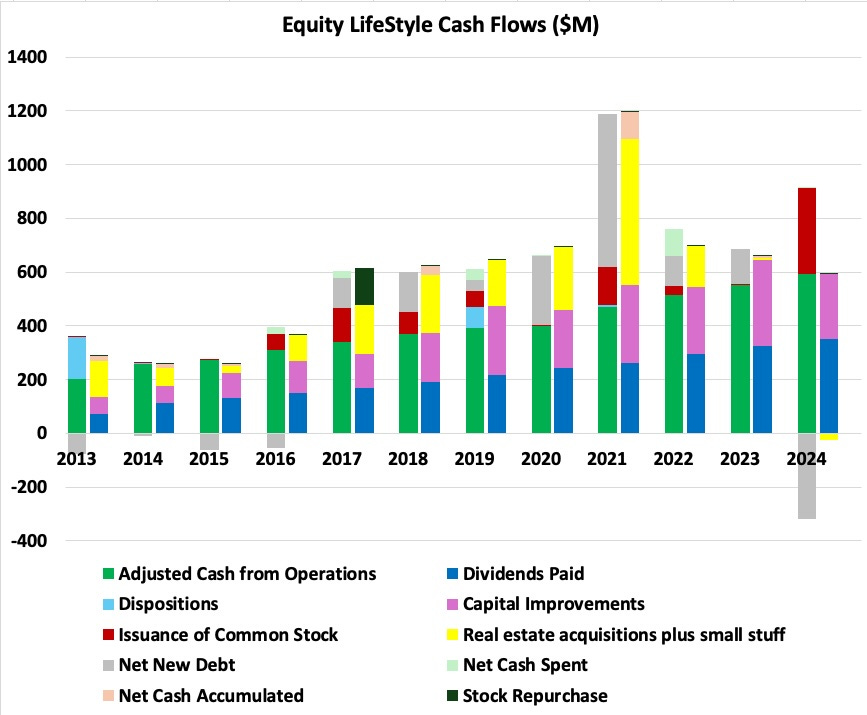
This is in my usual format with the left bar of each pair showing sources of cash while the right bar shows uses of cash. For many REITs, including their peer Sun Communities, stock issuance (red bars) has been dominant over Cash from Operations (green bars), especially across the 2010s.
Not for Equity LifeStyle, whose CfO has been the primary source of cash to drive growth. This is a far more stable and secure business model, compared to many REITs.
That CfO paid for the dividends (blue bars) and for the capex (purple bars), discussed above. Acquisitions (yellow bars) often were paid for by issuing new stock and/or new debt (gray bars). In Q4 of 2024 they issued stock and paid down a comparable amount of debt.
In 2021 Equity LifeStyle issued quite a bit of debt, increasing their ratio of Debt to Gross Assets to 47%. They used the funds to acquire a number of properties, presumably distressed. Only with the stock issuance in 2024 did they pull that ratio back down below 40%.
Overall, what we have with Equity LifeStyle is a business model that can produce NOI growth at a CAGR above 5%, with minimal issuance of shock. So with a dividend below 4%, proportional corporate costs, and an unchanging earnings multiple in the market, an ELS shareholder should see a total return in the high single digits.
A major source of that 21% CAGR across the 2010s was multiple expansion. From 11x in early 2010 the multiple of Price to CfO peaked above 32x in late 2019. Today it has dropped back to 22x.
So nice to triple your money for no company-specific reason, but not reproducible.
Earnings Measures
Beyond the multiple expansion, the ratio of CfO to NOI increased across the 2010s. That was because interest expenses, as a fraction of NOI, dropped from 32% (in 2013) to 20% in 2019. Both declining interest rates and a declining Debt Ratio contributed.
That too is not reproducible. The only way CfO/NOI keeps increasing from here is if ELS pays down enough debt to offset the impact of higher interest rates discussed above (unless the sugar fairy pushes down 10-year interest rates).
Here is what the earnings measures look like graphically:
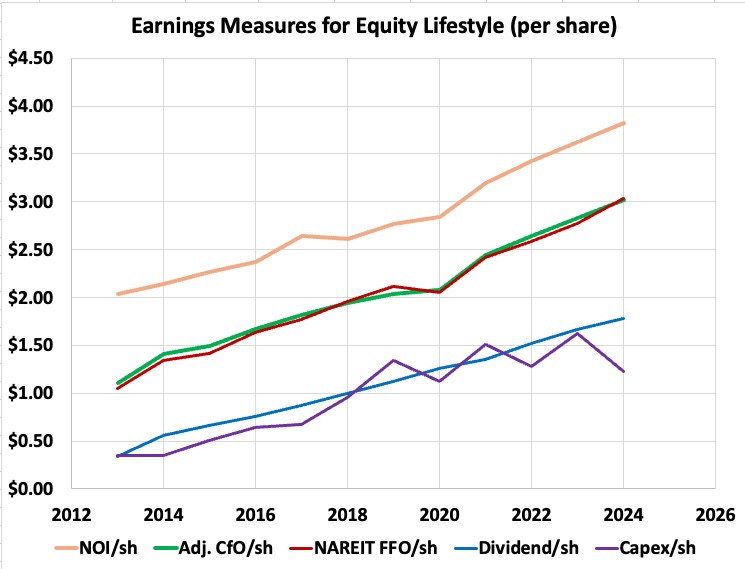
We can note that FFO/sh and CfO/sh track closely. This indicates that in this case the accountants failed in their apparent goal of making GAAP so distorted that investors can not easily know the truth.
CfO increased from 55% of NOI in 2013 to 74% in 2019, thanks to declining interest costs. It has stayed in the high 70s since 2020.
The capex has risen from about a third of CfO to about 50% over this interval. Recurring capex is about 40% of the total, or 20% of CfO. So Funds Available for Distribution (FAD) is about 80% of CfO.
Using this estimate, the dividend payout ratio on FAD is about 70% of FAD. This is safe, and leaves good retained earnings to support growth.
The CAGRs are informative. From 2013 through 2024 NOI/sh grew at 5.9%. CfO/sh grew at 9.5%, with that relative decline of interest expenses creating the difference. FAD/sh grew at about the same rate.
The dividend grew at a CAGR of 16.2%. A lot of that was due to an increase in payout ratio from 35% of Est. FAD to 71%. There is no longer room to grow the dividend much faster than FAD/sh and CfO/sh grow.
Where we end up is that the sustainable growth rate of CfO/sh, FAD/sh, and the dividend is below 6%. If 10-year Treasury rates stay high, that likely drops to 5% because of refinancing costs. And this assumes that the rest of the business is not disrupted in some way.
This is solid but is no longer magical.
Valuation
There is not enough of a market for the properties that Equity LifeStyle owns to give much guidance, in my view. So cash flows need to be the main path to valuation. Let’s look at that.
My calculation that generated the following plot had these elements:
Begin with the 2024 estimated FAD of $2.53.
Assume constant growth at 4%, 5%, or 6% for 20 years.
After that assume 2% growth.
Plot the implied NPV vs discount rate.
The result, showing also the current stock price and 130% of that as dashed lines:
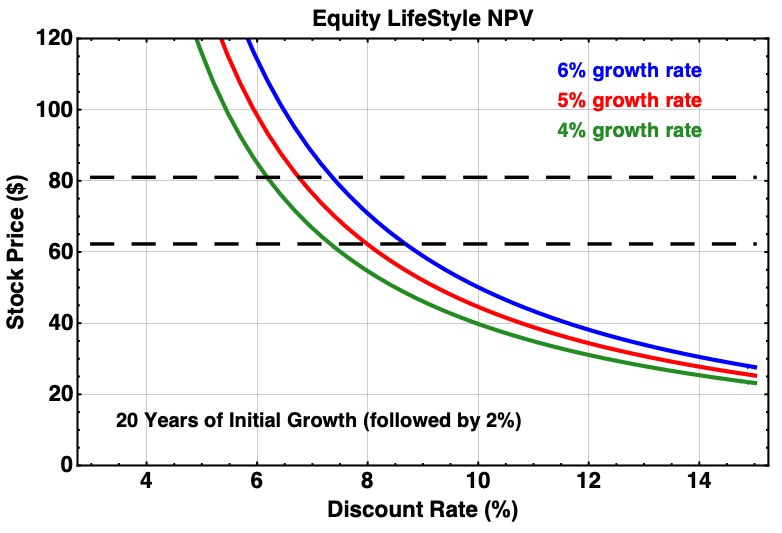
The 20 year period of growth is not cast in stone. But varying it from 10 to 30 years only moves the discount rate to match the market value by about ± 100 bps.
During 2020 I was finding opportunities that discounted future earnings at 10%, but ELS remained too highly priced. If you want to meet that standard today, then you should pay $45, give or take, for ELS. That is 18x current FAD while the market price is 25x FAD (and 21x CfO). In this case, you would view ELS as priced 40% higher than you want to pay.
The stock market today is valuing future FAD, on this model, with roughly an 8% discount rate. If you consider that BBB- bonds are priced near 6% today, and that there should be some equity risk premium, this is not crazy.
To end up inferring a significant undervaluation, one has to push the discount rate down near 7%. In my view that does start to get crazy, when 20-year Treasury rates are not far below 5%.
My conclusions:
Equity LifeStyle is an outstanding company. I like it far better than Sun Communities.
Their stock, ELS, is fairly valued today, for today’s interest rates.
If earnings multiples stayed constant, ELS ought to generate high-single-digit total returns. But only a bit more than 3% would come as dividends.
In contrast, another strong grower, Regency Centers (REG) is now priced at a 4% yield. I own REG but see no point in adding ELS.
Please click that ♡ button. This helps push Focused Investing up on the Substack feed. Also please restack, and share. Thanks!
Have a nice position in ELS but not buying more yet, I'd rather start a REG position (tomorrow after the PFF rebalance is over).
Great analysis. Thanks Paul. I'll track ELS. I like the space. I get some if it comes down.