


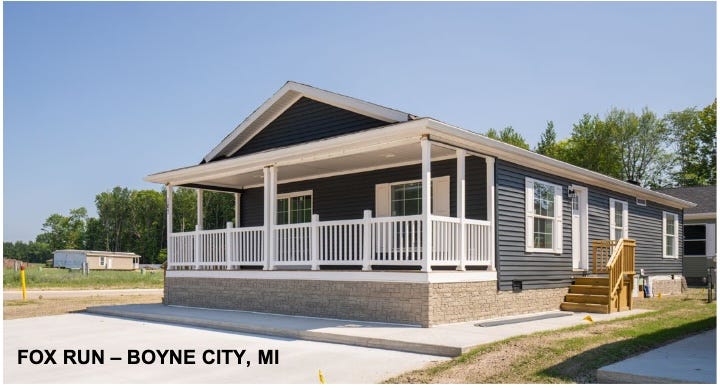
Is Sun Communities Worth Buying?

Sun Communities (SUI) is nearly a cult stock. Many authors have been telling investors for years that this is where you should put your REIT money to grow it rapidly, despite the abysmally low dividend.
And no wonder. The stock price increased 4x from the end of 2010 to the end of 2021, for a CAGR of 18%. Here we explore how that happened and what the future may hold.
That price history, on a semilog plot, is impressive:
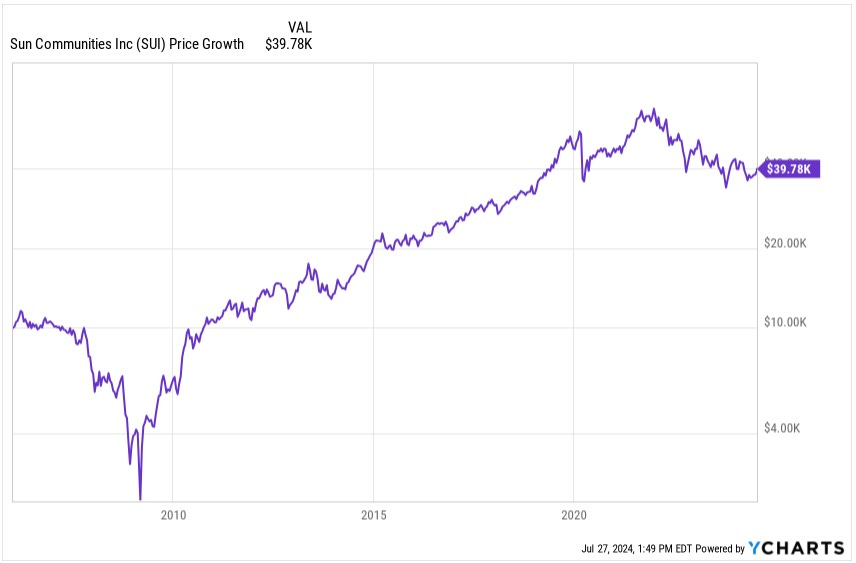
From 2011 on, this shows clean compounding growth, with significant deviations in only three periods. These were the bull market of 2019, the bull market of 2021, and the bear market starting in 2022.
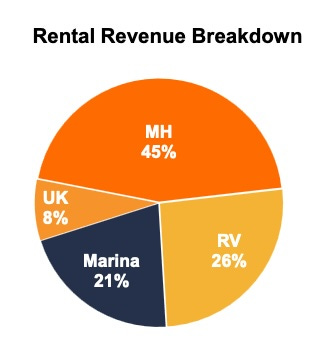
Opening the REIT Box
Sun invests in Manufactured Housing, Recreational-Vehicle Parks, and recently marinas. Here is the breakdown:
Of course many factors contribute to the share price, not all of them economic. We look first at the economic factors from the past, to help us become better able to think about the future.
Let’s open up the REIT box and look at some of the pieces. Start with per share earnings measures:
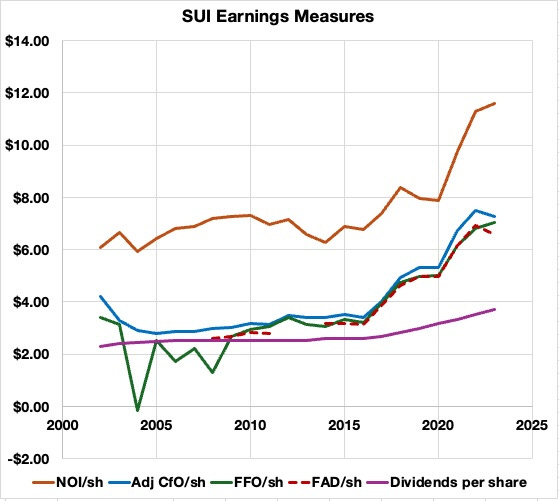
As was explained in detail here, the single most important driver of economic returns is the increase in per-share Net Operating Income, or NOI. It is a concern that NOI/sh is flat on net from 2002 through 2014.
This is also true, mostly, of other parameters shown. These are per-share:
Adjusted Cash from Operations (CfO), based on the Statements of Cash Flows
Funds From Operations (FFO), distorted before 2010 until impairments were removed but still not fundamentally reliable.
Funds Available for Distribution (FAD), which is CfO less recurring capex (and less capitalized interest, but that is tiny here) This quantity has much in common with the usual AFFO, but is more complete and harder to game.
Dividends
So what happened before 2010? The industry encountered huge problems in 2004. Here from the 2004 10-K:
In recent years the operations of manufactured homebuilders, dealers,
and the companies that finance the purchase of the homes have experienced severe losses and substantial volatility. ... The decline was largely due to the turmoil in the financing side of the industry as lenders experienced substantial losses arising from defaults on poorly underwritten loans in the mid to late 1990s and beyond.
As a result of these industry conditions, a large quantity of homes
repossessed by lenders have become available for purchase at discounts of up to 50% and more from original cost or loan amount. The Company has made every effort to acquire these value-priced homes especially as the alternative would likely be the removal of the homes from the community. This is a great example that any class of real estate can be impacted by exogenous factors. In this case it was what the financiers did.
Some key ratios, in combination with the above, illustrate what happened:
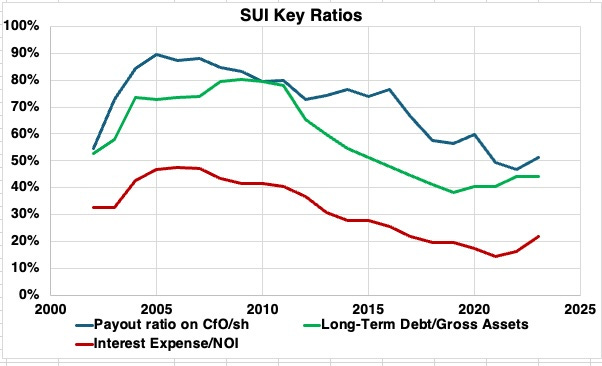
As Sun bought homes like mad to keep them in their communities, debt (green curve here) rose strongly as did interest expenses (red curve), driving down CfO/sh and raising the payout ratio (blue curve) above sensible levels. But SUI resisted cutting the dividend and just toughed it out, as they later did across the Great Recession.
They managed to pull their payout ratio down to 80% by 2010 and began to reduce Debt/Gross Assets after that. Overall, the Debt Ratio declined from a dangerous level of 80% down to near 40% today.
But what enabled some growth of CfO/sh, despite a decline in NOI/sh through 2014, was the steady decline in interest rates (red curve). Interest expenses dropped from nearly 50% of NOI in 2006 to 14% in 2021.
Transitions After 2011
Beginning in 2012, Sun adopted a very aggressive external-growth model. They issued lots of new stock, diluting shareholders by an average of about 18% per year through 2022.
But the market price was high, so their FAD yield was far below the ROE on deploying capital. With the addition of reasonable debt, this let them push up NOI/sh at a high rate.
By the end of 2014, NOI/sh and the dividend were up about 6% from 2004 and FAD/sh was up 23%, but the stock price was up 40%. This difference (40% vs 23%) reflected multiple expansion; earnings were more highly valued in 2014, even if they were not yet really rising.
After 2014, though, the trends were much more positive. Then they accelerated after 2020. This table shows the CAGR of the earnings measures over two intervals, 2014 through 2019 and 2019 through 2022.
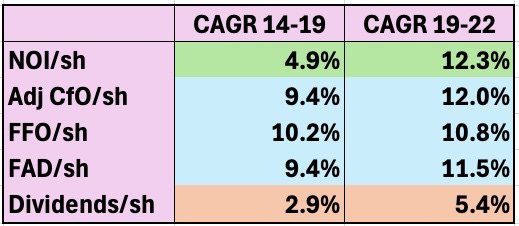
From 2014 through 2019, NOI/sh grew at nearly 5%, a good rate for a REIT. But it was the reduction in interest expenses that was the main story over that interval.
This reduction enabled the growth rate of FAD/sh and other measures to be about twice that of NOI/sh. Dividends did not keep up; SUI was driving down the payout ratio.
Then from 2019 through 2022, NOI/sh increased much more quickly, This reflected the explosive demand for RV sites during the pandemic and for homes after it.
FAD/sh kept up as interest expenses moved little on net. But SUI continued driving down the payout ratio and again the dividend growth lagged.
What is absolutely essential to the current era and likely future is precisely that reduction in payout ratio from 90% in 2005 to near 50% today. This gives them substantial retained earnings that can be reinvested no matter what the stock markets are doing.
Curiously, there is no mention of “payout” in the Q4 calls from 2014 through 2016, or after 2017. On the 2017 call CEO Gary Shiffman noted that they raised the dividend in part because their payout ratio was then in the range of other REITs.
The failure to mention this is bizarre. They pushed the payout ratio down for 17 years, through 2022, before letting it increase a bit last year. Most REITs would have been trumpting this as an accomplishment.
Sun are likely now near the minimum distribution required to retain REIT status. So going forward dividend increases should keep up with FAD/sh.
[There were some challenges in their U.K. activity after 2021, especially involving a loan they made. But these seem to be resolved now and were not large enough to derail the trends discussed above.]
After the stock market turned against them, Sun issued no new stock in 2023. This is commendable; doing so in that year would have decreased per share earnings.
And you can see in the above plot that NOI/sh increased in 2023 much more slowly. It grew at only a rate of 2.5%. A 2.5% increase in share count, mainly related to Operating Property units, offset the 5% increase in NOI.
More than the flattening of NOI/sh growth, what matters today is the impact of recent interest-rate increases. Interest expenses (as a fraction of NOI) have doubled since 2021. This has prompted dramatic changes in the focus of Sun Communities.
Let’s take a look.