


Study Design Can Make Investments Look Worse Than They Actually Are

Lyn Alden, whose work I greatly admire, has a fascinating piece out looking at the long term, with the encouraging title Most Investments are Actually Bad. Here I consider that thesis and show why it is not relevant to actual investing.
Lyn starts by looking at nearly a century, from 1928 to today. The broad US money supply increased over that period by more than 400x. Some other numbers for context: the CPI increased 18x and the real GDP increased 20x.
Gold increased in dollar price by about 100x, turning a $100 investment into $10k. Thanks to ongoing production the amount of gold quadrupled. So the toal market value of the gold roughly tracked the increase of money supply (~400x).
An invested $100 that kept up with inflation would be nearly $2k today. And indeed if you invested in T-bills and compounded the gains, you would have $2.2k. Longer T-Bonds would have reached $7.3k, sharing in some of the GDP gain. So gold beat bonds for those with long-enough horizons.
Lyn then discusses returns from holding common stocks. She seems to believe that he results of studies by Hendrick Bessembinder are relevant to the actual returns that investors achieve from holding common stocks.
I’m going to disagree, but first let’s look at Bessembinder.
Looking for Good Stocks
Hendrik Bessembinder, a professor in the Department of Finance at Arizona State University, decided to work with large amounts of available data on common stocks. Thanks to computers was able to examine the behavior of 26,000 US stocks for an article in the Journal of Finance in 2018.
He has later, unpublished work on a much larger number of global stocks. It reaches similar conclusions.
These articles prompted much media coverage, which I’m sure was appreciated by his dean. And since as far as I can tell, very few finance professors have any understanding at all of actual business operations or investor realities, his colleagues are probably impressed too.
Lyn Alden cites an unpublished study available on SSRN but it does not completely explain Bessembinder’s algorithm. I found the details of the math in his first relevant paper [Journal of Financial Economics 129 (2018) 440–457)] and not in the later 2021 summary paper in the Journal of Investing. Bessembinder calculated the returns for a stock as follows.
From its initial listing until an eventual delisting, if any, he compounded the capital gains. This produces what he describes as the return on the stock.
For each year, he extracted the dividends and put them in an account holding T-bills, where they later compounded in value at the T-bill rate and not at the return that would have applied had they been re-invested in the stock.
He defines shareholder wealth as the sum of the compounded value of the stock and the value of the T-bill account.
He compares the results to the return produced by investing only in T-bills.
Bessembinder has a way to account for buybacks, but from the math in the paper they reduce, rather than increase, the value of an investment in the stock. Well, perhaps that nonsensical result is just a typo, and one hopes that the computer model is free of them.
Using this methodology, Bessembinder finds that a majority of stocks produce a negative lifetime return, often reaching 100%. But this is no surprise.
Many firms list at some price, perhaps produce positive capital gains for awhile, and then steadily lose value until they delist. What we do learn from the Bessembinder study is that this turns out to be the majority of the 26,000 stocks analyzed.
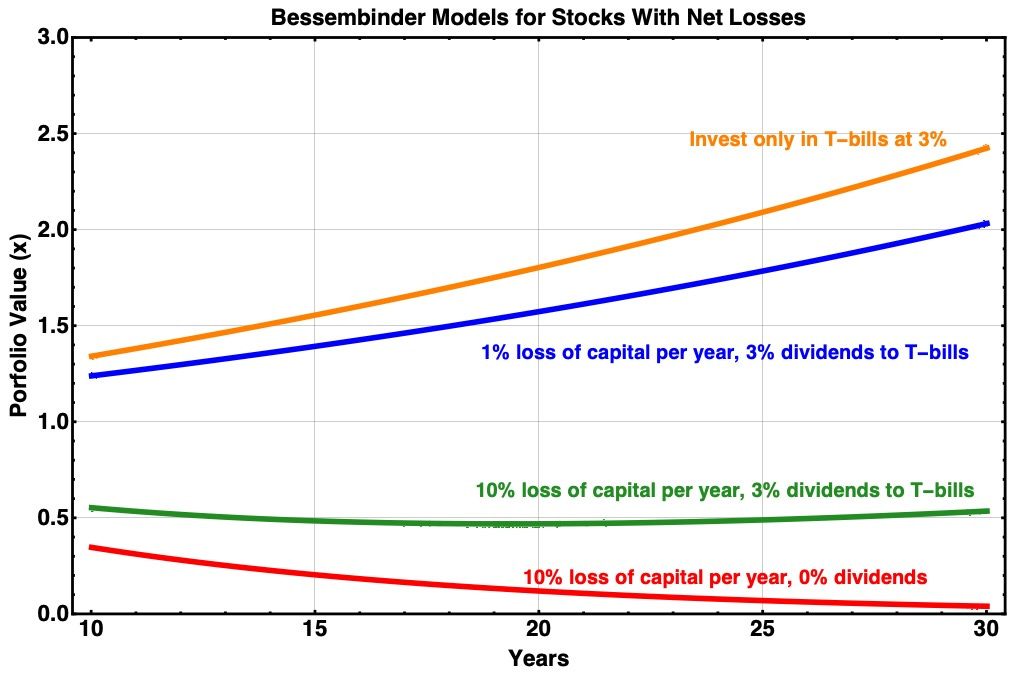
We can see the main trends here with results from a very simple calculation. Suppose both T-bill returns and dividends are 3%. We compare the Bessembinder result to investing in T-bills only for stocks with persistent capital losses, getting this:
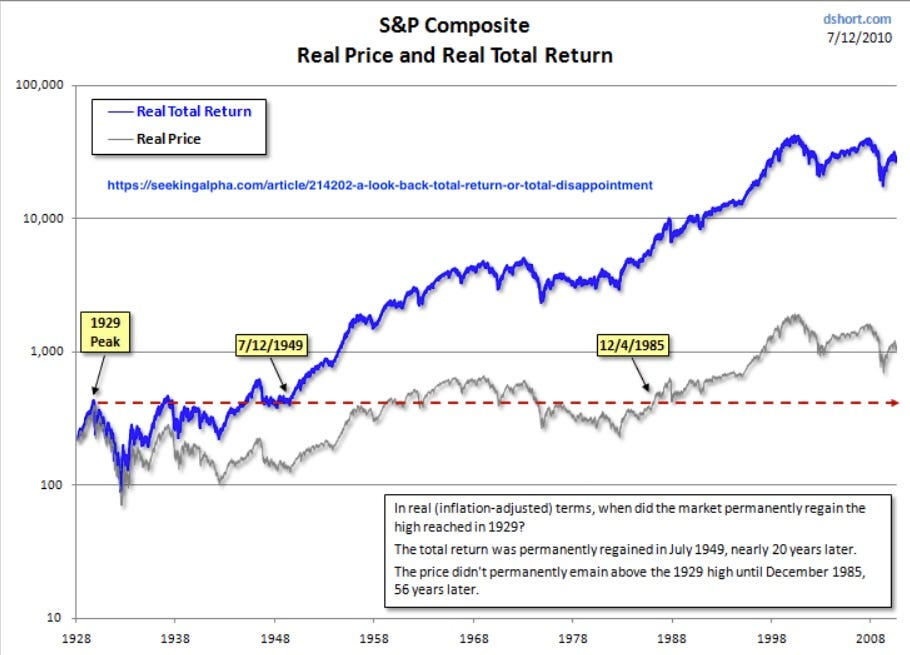
But we also know that S&P 500 stock prices have more or less kept up with inflation, as have T-bills. Here is what we saw through 2010, from an article on Seeking Alpha. The real S&P 500 price compounds at about 3%. This is not so different from real average T-bill rates.
The 500 did a lot better across the 2010s, an anomalous decade in many ways. But maybe the modern emphasis on buybacks had a positive impact. That era started in the 1980s, and the 500 did increase faster than previously from then through 2008.
Bessembinder versus The Optimists
It is worthwhile to contemplate the Bessembinder restults in the light of the studies discussed in The Triumph of the Optimists, by Dimson, Marsh, and Staunton published in 2002. They show that real returns from index stocks exceeded 8% per year over the 20th century.
This was a tremendously important conclusion. It documented how stock-market investments had genuinely built wealth over time.
It seems that Bessembinder reached the opposite conclusion. But he did not consider the same problem.
Interestingly, Besembinder does not mention Dimson, Marsh or Staunton in either his 2018 paper or the later paper available on SSRN that Lyn linked. In my eyes, this is a significant failure of scholarship.
He finally mentions them in one paragraph in his 2023 paper in The Financial Analysts Journal. He attributes the entire difference in outcomes to the skewness of the distributions of returns, in which a few stocks actually do produce massive capital gains.
That paragraph is a classic academic dismissal of an essential important alternative set of evidence without thought or effort. He offers no quantitative analysis. Again, in my view, a failure of scholarship.
Well no doubt the skewness contributes, but the rest of the story is seen in the difference between the green and blue curves in the plot below. Getting the total return from reinvesting the dividends back into the stocks is very likely an important contributor.
The Relevant Story
We actually know that long-term, real, total returns were around 8% for investors in large-cap stocks. Let’s look at the simple calculation if capital gains and T-bill returns are both 3% and dividends are 5%.
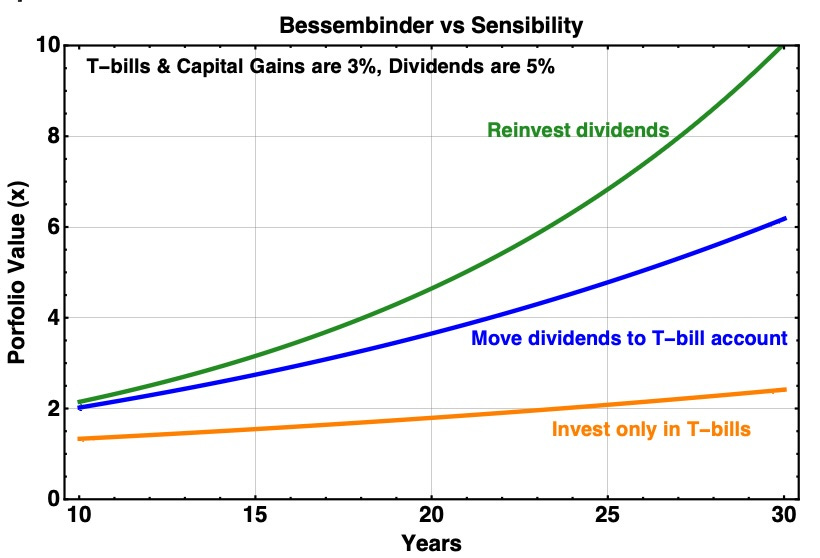
Here the blue curve shows the Bessembinder calculation, which does have wealth creation by his definition, and at a 6% CAGR. But one gains more (and gets the 8% CAGR) by reinvesting the dividends back into the stock. My conclusion is that Bessembinder underestimates the real returns available to investors, as a result of his bizarre choice of what to do with the dividends.
Still a significant result from Bessembinder is that few companies have proven able to grow their value at rates much above inflation. So whatever retained earnings they reinvested were on net mainly able to sustain real revenues, rather than increase them.
The sad reality is that many “growth” companies have proven to be abysmal value creators and have instead lit on fire a lot of shareholder capital. A current example is Hertz.
To my mind the approach modeled by Bessembinder makes little sense. Neither buying random stocks and holding them until they die nor investing the dividends only in T-bills is a reasonable representation of investor behavior.
Of course, we do know that most individual investors defeat the potential found in The Optimists by counterproductive behavior, such as selling low and buying high. But they certainly are not doing what Bessembinder modeled.
Looking for Good Real Estate
Lyn moves on to a discussion of real estate. She notes first that if you randomly bought real estate a century ago, your long-term returns would have been less than those from holding gold.
Her numbers indicate that you would have beaten inflation by less than 3x over 95 years. A poor return indeed.
She goes on to say
But in contrast, significant amounts of real estate goes to zero if the city they are near decreases in population and economic activity. For example, there are abandoned properties all around Detroit. These are large once-expensive homes that are now rotting on parcels of land that nobody wants. And real estate can’t be moved if the economic situation or political situation in a region becomes untenable.
I’m sorry but in my opinion this is flat out wrong. Apparently there are about 80,000 abandoned buildings in Detroit (not just houses), though recent progress may have that going down. The city proper saw its population drop by nearly a factor of two across recent decades.
But in the Detroit MSA there are 2 million houses. That 80k is 4%. So a real estate investment that randomly sampled a large collection of properties only within the Detroit MSA would have seen a loss of 4% from those abandonments. (Well perhaps somewhat more since the MSA has grown. But going down that rabbit hole seems not worth it.)
Meanwhile the other 96% of properties were holding their value or seeing it increase. Not to mention properties throughout the populous belt across all of southern Michigan. Southeen Michigan is far from a wasteland.
Lyn correctly points out that it is owner operators of real estate who are the big winners, especially if they make intelligent use of leverage. But she does not think outside passive investors can benefit.
To my mind this is too blanket a statement. I have friends, for example, who have gotten excellent returns from participating as passive investors in privately offered real estate development or redevelopment.
Their decision to invest is not, however, passive or random. They closely scrutize the opportunities and the offerers. And each opportunity is discrete and of finite length.
What REITs Can Do
But of course my focus is publicly listed REITs. The quality REITs do a good job of growing shareholder value, but NOT from just owning and operating properties.
There are some REITs that do not own property but somehow conduct an ordinary business from within a REIT shell. Billboard REITs are an excellent example. Tower REITs also, although they do own the towers, usually.
These are REITs in name only. Their earnings and earnings growth does not center on earnings from properties. Here we focus only on REITs that own properties.
What is common to all REITs is the requirement to distribute 90% of taxable income as shareholder returns. These nearly always come as cash dividends.
For REITs owning properties, rent growth increases FAD by 2% or so (details vary) and lets earnings keep up with inflation, more or less. These increases will be higher when inflation is higher. This will get you dividend growth at near the rate of inflation and also stock price growth at that rate, during periods of constant earnings multiples.
For reasons not worth our time here, most quality REITs payout 75% of FAD and so are able to retain 25% of FAD, give or take. If they can invest 25% of FAD at 8%, then grows FAD by 2%. That gets you roughly the real return of T-bills.
From these contributions overall, FAD grows by 4%, give or take. This is reduced by headwinds, such as tenant bankruptcies or increasing interest costs. It increases when higher inflation drives rents up more quickly. [Aside: new REITs often produce a few years of much faster growth as they scale up.]
When you look at the history of large, established REITs during this century up to 2020, the weak performers grew per share cash earnings at say 2%. Most such REITs managed 4%, and a few produced more than 6%. One of these big “winners” was AvalonBay (AVB).
To get the long-term compounding this makes possible, shareholders have to take the step imaginged unlikely by Bessembinder and reinvest those dividends back into the REIT. This gets them economic returns that substantially exceed the yield of T-bills because the dividend yield is significant. Total returns in the stock market then also depend on how earnings multiples change.
The upshot here is that the cash earnings increases from solid REITs give you roughly T-bill results, with some of them delivering a couple hundred bps more than that. But if you reinvest the dividends, that pushes the total returns into the high single digits or low double digits.
Two significant side notes:
The quality REITs all use quite modest leverage. The ratio of Debt to Gross Property is always well below 50%.
By owning hundreds or thousands of properties in many locations, these REITs ameliorate the local-failure risks discussed by Lyn.
Let’s look more deeply at two important REIT subsectors.
Multifamily REITs
There are several, large REITs with very high credit ratings whose focus is multifamily properties. These REITs do make money from operating properties they own, and they pay out a lot of that to shareholders.
They can grow per share FAD by the means described above at 4%, give or take. They can push that higher by effective capital recycling to fund development and by doing higher-return redevelopment projects.
In addition, when the stock markets are favorable, they can get more growth by issuing stock and investing the proceeds. This is not tremendously efficient but can contribute.
What’s more, when inflation pushes up propery values they can add debt without increasing the ratio of Debt to Property Value. Then they can increase FAD/sh by investing those proceeds too.
These REITs hold many properties across a significant number of regions. Their intent is to make good choices about where to buy, sell, and develop over time.
Let’s look at the example of AvalonBay, one of the most successful REITs at growing FAD/sh long term. We use the available Cash from Operations per share (CfO/sh) as a surrogate for FAD/sh. FAD/sh runs about 80% of CfO/sh.
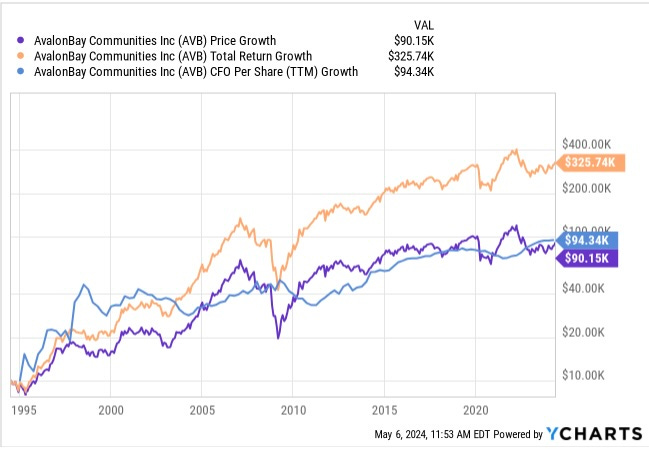
From 2000 to 2024, the CPI grew 1.8x. CfO/sh grew 3x, providing a CAGR of the real increase of 2.2%. That CAGR would be larger if one looked back to 1995.
This is not so far from average historical, long-term, real T-bill returns. A side note here about non-REITs:
Most “growth” firms pay out or otherwise return to shareholders a much smaller fraction of FAD, or nothing.
So the REITs produce comparable price growth while paying out far larger dividends.
I admit to being biased, but other than trying to find the next Apple, why would you want to put your money in any low-dividend stock?
Meanwhile the AVB price grew 6x across 2000 to 2024. This reflected a doubling of the earnings multiple. This doubling was effectively a boost in share price at a 3% CAGR, but it did not reflect economic performance.
Across that same interval, the total return was 16x, producing a real return CAGR of 9.5%. This of course trounced T-bills, for anyone dumb enough to have stuck their dividends into T-bill accounts.
Conclusions: Quality multifamily REITs have the means to grow FAD/sh at a CAGR at least comparable to the real yields of T-bills. Their dividends then provide an economic return that far exceeds what you can get from T-bills. For long-term investors, reinvesting those dividends enables performance like that found by Stimson, Marsh, and Staunton, vastly in excess of that expected from the Bessembinder study.
Triple Net Lease REITs
The details differ but the result is similar for Triple Net Lease REITs. These lease properties under triple-net leases, which require the tenant to pay for all maintenance, insurance, and taxes.
These firms all own many properties (hundreds or thousands) in widely spread geographies. They are not significantly vulnerable to localized economic collapse.
The rent dynamics is different from that of the multifamily REITs, reflecting the much longer leases. During periods of substantial inflation, leases may terminate with a large difference between rent paid and market rent.
On renewal, the new rent has to close most of that gap. The resulting rent jump, on each year’s tranche of properties, produces a reasonable overall increase in rents for the whole portfolio. This is how rents approximately keep up with inflation.
Details differ in many ways among these firms. Their leases have different escalator structures. They target different types of tenant. And lease terms and debt maturities vary too.
These REITs have a number of tools that can boost their growth of per-share cash earnings. Different tools work for different specific market segments. These tools include:
They can buy quality real estate that is very likely to retain value no matter what happens to the tenant.
They can buy properties at less than market value and/or replacement value. This sounds counter-intuitive until you realize that the lower rent corresponding to a lower price may benefit the tenant more than reaping the highest possible price.
They can use master leases to prevent a tenant from just dropping a lease on a single property.
They can get property-level financial reporting so they can be proactive in portfolio management.
They can include escalators that assure regular increases in rent. Details vary greatly for these.
All the above lets them continually refresh their portfolio with modest gains and few losses.
In some circumstances it can be sensible for such a REIT to recycle capital, selling in-demand properties and buying undervalued ones. Before getting bought out, Spirit Realty Capital was steadily selling retail to buy (non-warehouse) industrial.
But mostly extra growth in these REITs comes when the stock price is high enough, relative to cap rates. Then they can add value by issuing stock and buying more properties.
This is not terribly efficient so one has to expand the portfolio a lot to produce modest gains in per share earnings. Here are some examples:
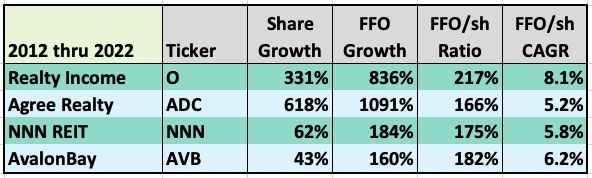
The two REITs who pursued this approach most strongly were Realty Income (O) and Agree Realty (ADC). Both produced massive increases in share count and Gross Property to obtain relatively modest increases of FFO/sh. [For Realty Income well-chosen mergers were key.] These two also historically have had low escalators, reducing the growth they got without issuing stock.
At its peak valuation, O was priced at about 150% of its consensus Net Asset Value (NAV). Even for an 8% growth rate, buyers were discounting more than 6 years of future growth in setting the share price. A bit excessive, eh?
I personally am most fond of NNN REIT, which I wrote about recently. They managed to get a very respectable increase in FFO/sh with a much more modest increase in shares and Gross Property.
Conclusions: Quality triple-net-lease REITs easily can grow FAD/sh at a CAGR that will equal and can significantly exceed the CAGR value from holding T-bills. And that is before the impact of dividends. For constant market earnings multiples, double digit compounding is possible if one re-invests the dividends.
Takeaways
So are most investments actually bad? Well that depends.
If your thesis is that one should choose investments at random and hold them forever, then that statement is probably true. If that is the best you can do, then holding gold (or better yet a basket of commodities) may be better for very-long-term holds.
Plus, really that thesis is just a straw man put forward to be knocked down. No investor in their right mind would actually do that.
In reality common-stock investors over the last century have done far better than the Bessembinder study suggests, for two reasons. First, they invested in better stocks than the average among the 26,000 listed and did not hold anything until it declined to zero. Second, they reinvested dividends back into stocks and not into T-bills.
The story is similar in real estate. Diversification matters there too, and investing with a clear eye on where your returns will come from. REITs in particular can be a good way to obtain real and enduring returns from real estate investments.
I didn't read Bessimbinder but had a gut feel that it contained the type of gross error that Paul points out.
I have an even stronger gut feel that the "most investments are bad" theme was A) true and B) irrelevant.
I carry about 50 tickers at any given time. Of those, there are always 3 or 4 "longshots". The investment size is small. I've had a couple of monster winners (20X) and a long list of losers. I'm slightly ahead over all, but that's not the point. The point is that if you accumulate ALL the total losses I've had, since every time one goes bust I go looking for another one, the list of bad investments keeps on growing while the number of tickers I am managing remains at about 50. The longer I do this, the larger the number of bad investments in the list. At some point I expect that the total number of bad investments I have made will exceed the number of good ones.
So despite "most" of my investments being "bad", I've got a portfolio that has trounced the S&P. I just feel like the premise as stated doesn't take into account the reality of how people actually invest.
I looked at the Bessimbinder study years ago and I strongly suspected that there was some flaw in it. The conclusions simply did not seem to be compatible with real-world results of investors. I searched online for potential critiques of the study, but I don't remember ever finding one. It seems that you found some of the problems which no one else ever noticed, or at least ever commented on. Thanks so much for this article which appears to have solved a mystery for me that I've been wondering about for years!!