


Looking for Warts on NNN REIT

There are many reasons to like the horribly renamed NNN REIT, which was previously called National Retail Properties. There are also a few reasons for caution.
I appreciate their very conservative approach to capital management, about which more below. And to my mind their approach to tenant selection is superior.
Of course, the accolades are not enough. Let’s go look for some warts.
But First, Bullets of Praise
Before we get down to the main business, we can set the context with a bunch of the things to like about NNN:
BBB+ or equivalent credit ratings.
Zero secured debt; minimal floating-rate debt.
Well-laddered debt maturities, 12-year weighted average maturity
Well laddered lease expirations with 10-year weighted avg. term.
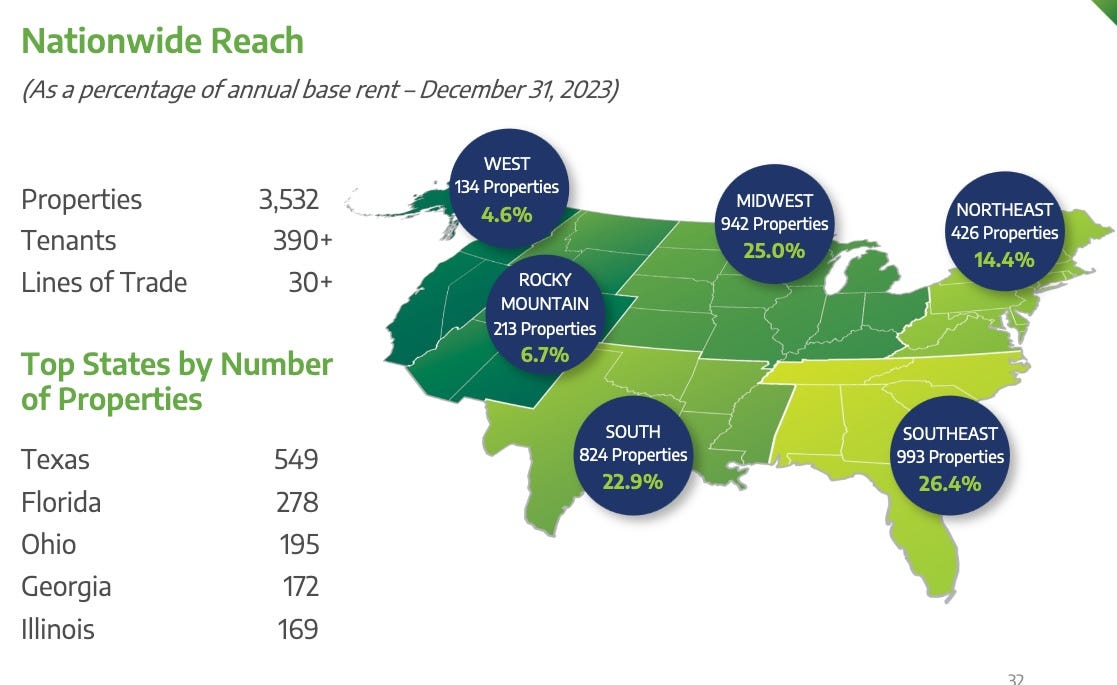
Very diversified: 3,532 properties (36.0 million SF) in 49 states
Average property value of $3M, enhancing fungibility.
History of high fraction of renewals.
History of small tenant improvement costs.
Largest tenant pays 4.4% of total base rent on 138 properties.
Seek private transactions and relationship-based sourcing.
New tenants are financially sound but rarely investment grade, with limited options for financing.
Dividend increases for 34 consecutive years.
NNN is one of very few REITs with a weighted-average debt maturity larger than the weighted-average lease term. Most REITs are more analogous to banks, borrowing short and “lending” (well, leasing) long.
Learning from History
I like to look back historically, not because that will project directly into the future, but because it provides insight into business models. Here are some earnings parameters for NNN:
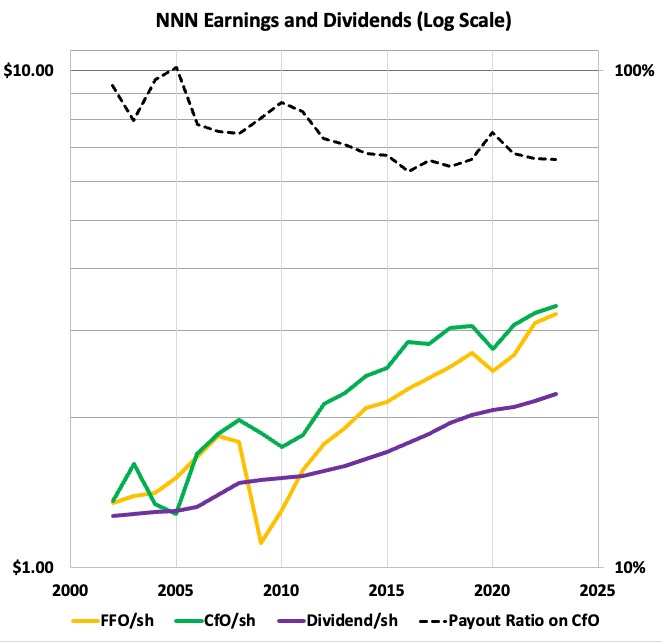
The measure that should be a good indicator of per-share cash earnings is (Adjusted) Cash from Operations per share, CfO/sh. The adjustment here is to remove changes in working capital.
The dips in CfO/sh before 2012 reflect changes in share count, not in CfO. It can take time for funds raised to be employed. And Funds From Operations (FFO) is impacted throughout by a significant number of both cash and non-cash costs that are not corrected for.
After about 2012 there was a period of stronger earnings growth until 2020. More on that below.
The dividend did evolve. The dashed curve shows how the payout fraction (on CfO) was around 90% in the early years of this century, which is too high.
NNN pushed the payout fraction down below 70% by 2013 and it has run in the mid-60s since. This level generates retained cash that, when re-invested, enables decent growth just by itself.
Overall from 2012 through 2023, the CAGR of share count was 4.7%, while that of NOI/sh was 3.9%, that of CfO/sh was 4.2%, and that of dividends was 3.3%. Such rates will, over the long run, keep dividends up with inflation.
Also the larger growth of CfO/sh than of NOI/sh reflected two temporary tailwinds. The ratio of G&A to NOI decreased. So did the ratio of interest costs to NOI.
How The Cash Flows Changed
The evolution of the NNN cash flows is informative. Here they are from 2011 forward:
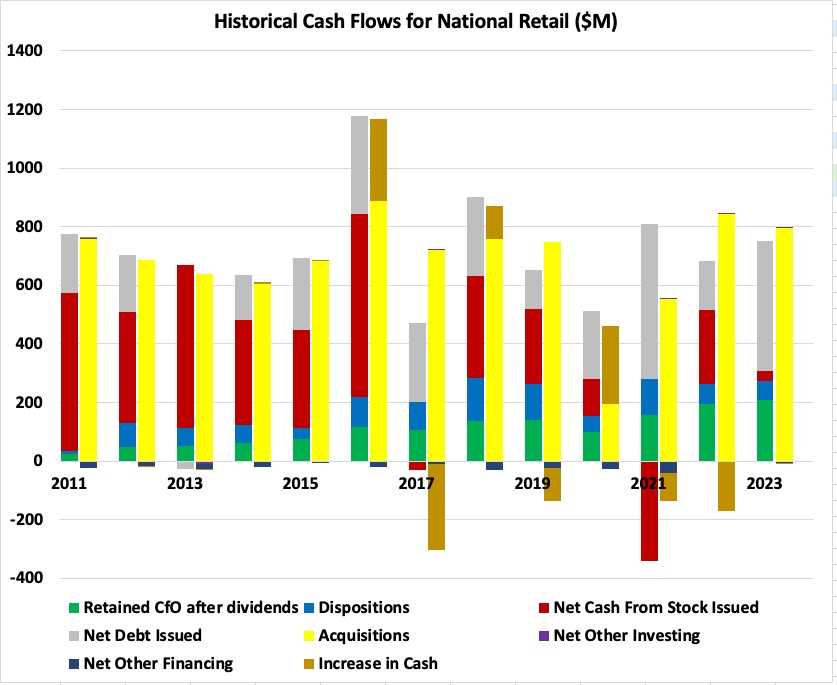
This is my standard display of cash flows. For each year, the left stacked bars show sources of cash and the right stacked bars shows uses of cash. For NNN, the uses are entirely acquisitions (yellow), although in some years cash (brown) gets accumulated or spent.
If you look back into the 2010s, NNN was driving the higher growth of CfO/sh by issuing stock (red) and adding debt (gray). They were not stupid, refraining from issuing stock when their stock price lagged across 2017.
By comparison, retained cash after dividends (green) and cash from dispositions (blue) were pretty small early on. We can note that, because retained cash is several times more effective than issuing stock or debt at driving growth, growth from retained cash was becoming significant later in the decade.