

A Simple Take on REIT Pricing


Unless 10-year Treasury rates go back to where they were in the 2010s, REIT multiples (and REIT stock prices) are unlikely to do so.
The main story relates to the interplay of property values and corporate cash flows.
One can find a lot of forecasts about the pricing of publicly listed REITs. Most of them, like forecasts generally, focus on minor factors that matter little.
Let’s look at what matters a lot.
For a balanced market, REITs will be priced close to the value that makes NAV = NPV. Here NAV is the Net Asset Value of their holdings. Accurately knowing NAV is a challenge at best, but this is part of what the market is trying to do.
NPV is net present value, the value of the corporate cash flows that are either paid out or reinvested for growth. This needs to be found based on FAD — Funds Available for Distribution. Other measures such as CfO and — god forbid, FFO — often yield inaccurate results.
The main features of REIT pricing are revealed by unpacking NAV = NPV. We will bring in earnings growth later.
The Asset Value is the NOI — Cash Net Operating Income — divided by the weighted average Cap Rate, here labeled CR. To get NAV one must subtract the debt, here expressed as a Debt Ratio, DR, the ratio of debt to total assets. So one has
NAV = (NOI/CR) x (1-DR).
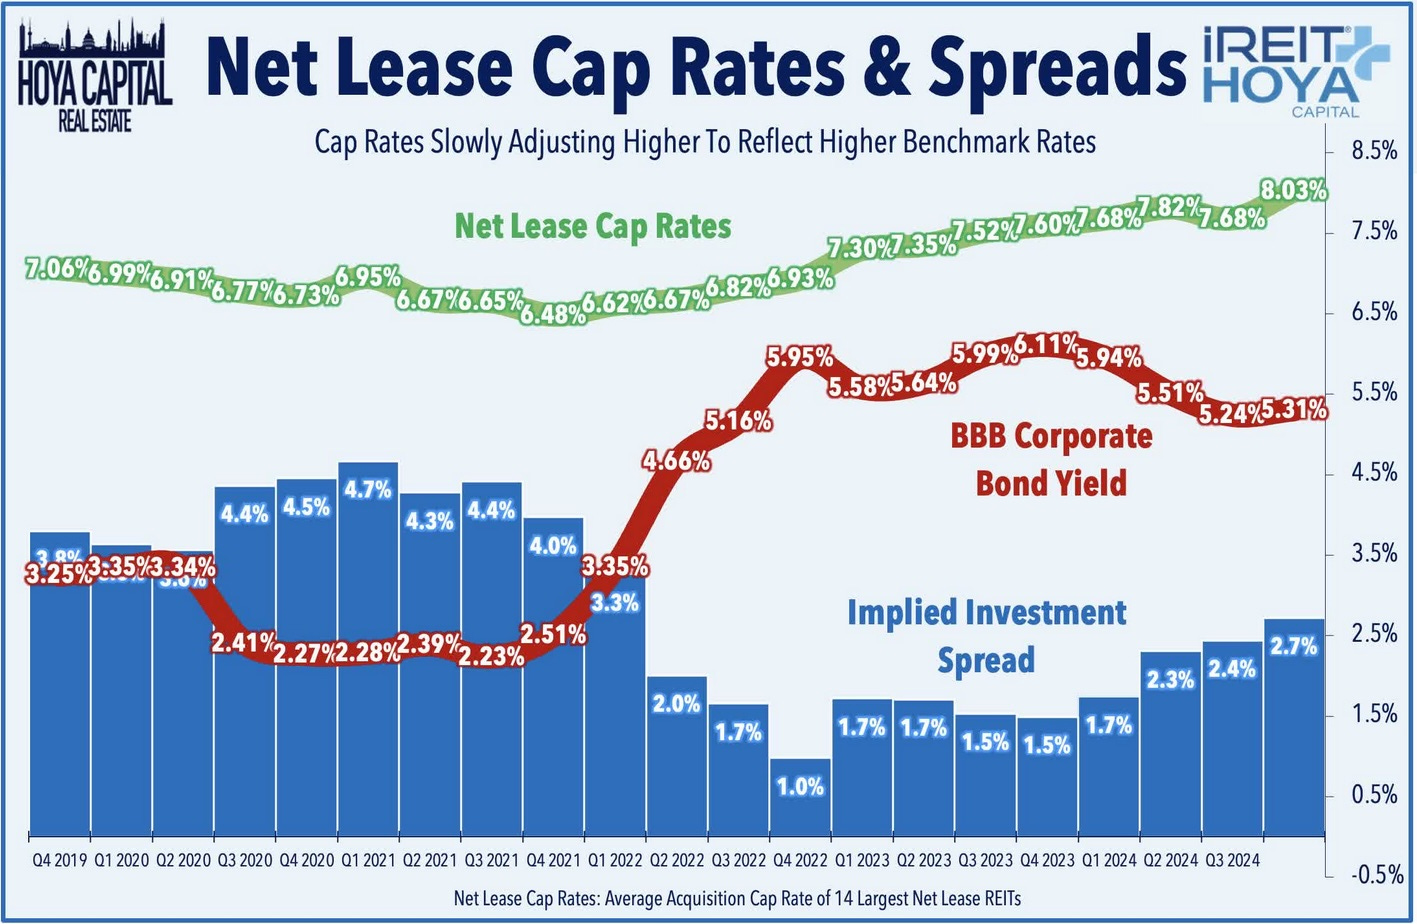
We can note that the Cap Rate in the markets responds to the long-term interest rates. It does this with a lag. According to Hoya Capital, Cap Rates for Net-Lease REITs have increased from a recent low of 6.5% late in 2021 to 8% in the most recent quarter:
We express NPV also as proportional to NOI. We have, for forward NOI and earnings that continue indefinitely,
NPV = NOI x [(FAD/NOI) /disc].
Here disc is the discount rate for valuing the cash flows. The ratio FAD/NOI is one minus a sum of costs (as a fraction of NOI). The costs are cash interest expenses, cash G&A costs, and recurring cash expenses. The recurring expenses may include maintenance capex, tenant improvement capex, capitalized interest, and other items.
The ratio FAD/NOI and the Debt Ratio vary. We discuss examples below.
Setting NAV = NPV for those two equations above implies the following one.
disc = CR [ (FAD/NOI) /(1-DR)].
The inverse of this is the fair value as a multiple on next year’s FAD, on the assumption that earnings continue indefinitely. Later decades add a lot to that value; for detailed evaluation one needs to think about that.
The earnings multiple will be larger than the common P/FFO because FAD is smaller than FFO. Implications:
REITs with higher Cap Rates and lower costs will be fairly priced at lower multiples.
So multiples for net-lease REITs should be smaller than those for shopping-center or apartment REITs, as they generally are.
But these differences can be offset by growth rates, as we see below.
The important global point is that there is no “normal” multiple for FAD (or FFO). The fair value multiple varies with Cap Rates and these follow interest rates with some lag.
So: unless 10-year Treasury rates go back to where they were in the 2010s, REIT multiples (and REIT stock prices) are unlikely to do so.
And here is one view of those Treasury rates:
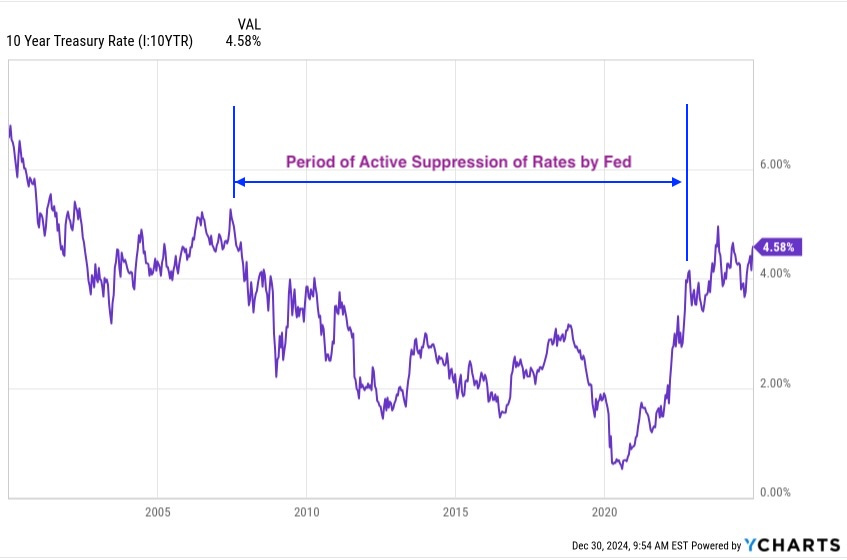
Going much further back than the plot, the evolution of this rate often reflect things the Fed did. There is a blow-by-blow account in Edward Chancellor’s book, The Price of Time, whose title title represents the fact that this is just what interest rates are.
One can find lots of nice pretty stories expounding on the deflationary impact of technology and anticipating 2010s or lower interest rates. But the fact remains that the 2010s was a period of active financial repression. Without that, the price of time would have been higher, though one cannot say how much.
Beyond that, it makes fundamental sense to me that real interest rates should be above zero. Long-term inflation has been nearly 3%, which makes seeing 10-year rates near 4% sensible to me.
This in turn suggests that Cap Rates are unlikely to go back to 2010s levels any time soon. As a result, neither are earnings multiples on REITs.
Now consider growth. If the earnings are growing, then the REIT is sensibly priced at more than NAV. The growth creates value.
If you set the annual rate to “gr”, then the earnings multiple becomes 1/(disc-gr). This is on the assumption that growth continues indefinitely.
Some Examples
We can see how this plays out via some examples. We start by comparing four cases, representing generic Net Lease and Shopping Center REITs at two different Debt Ratios. Between these two groups both FAD/NOI and cap rates vary.
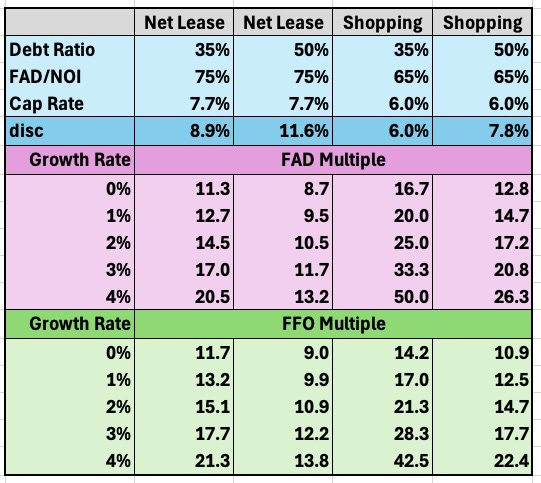
The top three rows, shaded light blue, show the input data. The row shaded a darker blue shows the discount rate for no growth.
Then the purple-shaded rows show the fair value P/FAD for the indicated growth rates. The output columns for each type of REIT show the impact of Debt Ratio. Few Net Lease REITs (maybe only ADC) are below 35%; all or nearly all are below 50%. That change makes a 30% difference in fair value.
Similarly, few Shopping Center REITs (maybe only REG) have Debt Ratio below 35%. But in 2021 Federal Realty Trust was up at 50%; it has come down a lot since. That difference also creates a 30% difference in fair value.
The second and fourth columns show model REITs with a 35% Debt Ratio. The second column has FAD/NOI and Cap Rates typical for Net Lease REITs today. The fourth column has FAD/NOI and Cap Rates typical for Shopping Center REITs today.
For the Shopping Center REITs, this produces a 48% greater FAD multiple for fair value, which is a direct consequence of the lower cap rate and higher costs. The difference in fair-value FFO multiple is only 20%, though, because the Shopping Center REITs have significant capex. (The fault here is that FFO is a bad financial parameter, but we are stuck with it as the easiest to find.)
Giving credit for growth makes a bit difference in the fair-value multiple, as you can see in the sequence of rows shaded purple and green. Even very modest growth makes a substantive difference in fair value. We apply that next for real cases.
We now return to ADC and REG. We also add NNN REIT (NNN) since it makes an interesting comparison.
The ratio FAD/NOI and the Debt Ratio are about 80% and 33%, respectively, for Agree Realty (ADC), shown in the second column below. They are about 65% and 28%, respectively, for Regency Centers (REG). The main difference is that Regency has much larger capex. The ratio FAD/NOI and the Debt Ratio are about 76% and 40%, respectively, for NNN.
We can find the ratio of NPV/FAD from the formulae above. We can convert this to NPV/FFO using the ratio of FAD to FFO for each REIT. Here are the result, shown with the same color coding:
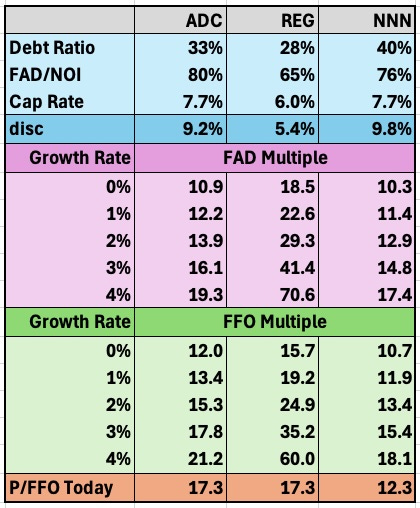
Looking at the row for zero growth, you see the impact of the differences in Cap Rates and capex in the comparison of the second and third columns. For no growth, REG should be priced at a larger multiple than ADC. That sounds good but what it really means is that you have to pay more to buy the same FAD.
The lower rows show the impact of various growth rates of FAD/sh. It is significant.
The green-shaded rows show the outcomes for P/FFO for various growth rates of FAD/sh. The orange-shaded row at the bottom shows current market ratios.
Both REG and ADC are priced today at the same value of P/FFO. But looking above the orange row, this implies an expectation of about 3% per year growth for ADC but less than 1% for REG.
In contrast, the higher debt ratio of NNN implies smaller multiples, as is clear in the math shown above. Still, NNN today is priced for just over 1% growth of FAD/sh.
My perspective here is that ADC will not grow FAD/sh at a lot faster than 3%. So ADC is at or near fair value for current cap rates.
In contrast, REG and NNN will grow FAD/sh at well over a 1% rate. For NNN the undervaluation is in the 10% to 20% ballpark.
What surprised me here is that REG appears from this model to be undervalued and perhaps by quite a bit. But you can’t trust the really large multiples (> 30x) seen in the table for REG at higher growth rates, because of the impact of later years.
If you do the sums for a finite number of years for REG, you find, for a 4% growth rate, that P/FAD only reaches 30x at year 40. But getting above 20x is much easier. For a 3% growth rate, P/FAD gets into the 20s at less than 30 years. (It always amazes me to see how dependent real estate pricing is on decades of income.)
So is REG undervalued today? Yes, because of their low cap rates and leverage.
How much? Hard to say because the distant future is obscured and captured poorly by such a simple model. Likely small tens of percents.
Takeaways
Cap Rates have a strong impact on fair values.
Cap Rates respond, with a lag, to interest rates.
Costs and leverage also matter, and vary both across and within REIT sectors.
Overall, most REITs today are fairly valued or modestly undervalued.
If you want to pump REITs broadly today, with a valid argument, then it has to be based on a macroeconomic case that interest rates will fall. I have no firm opinion about their direction.
As to me, I own REG, NNN, and some other REITs I see as safe dividend payers. These also may provide cash for investment in whatever REITs fall most in the next difficult period.
Please click that ♡ button. And please subscribe, restack, and share. Thanks!
Thank you, Paul! I see that FAD multiples are smaller than FFO multiples for net lease REITs. Can you comment on that?
Another great article Paul, interest rates have always been key to real estate value as expressed by cap rates. For me two things matter the most - management and growth. It's why I like ADC. Also, the one variable that you can't model is acquisitions.
Look forward to reading 'The Price of Time'. You may enjoy reading one of my favorites 'Against the Gods: The Remarkable Story of Risk' by Peter L. Bernstein.