


Simon Property Group: Challenged Growth

Simon Property Group (SPG) is a very solid REIT whose days of rapid dividend growth are numbered. Sorry about that but the reasons follow.
This year’s trip through their annual reports did not change my view that SPG should be a core holding for many REIT investors. But it did convince me that most analysts, including me previously, are too optimistic about growth prospects.
The self-description by Simon in their recent 8-K Supplemental is:
We own, develop and manage premier shopping, dining, entertainment and mixed-use destinations, which consist primarily of malls, Premium Outlets®, The Mills®, and International Properties. At December 31, 2023, we owned or had an interest in 230 properties comprising 183 million square feet in North America, Asia and Europe. We also owned an 84% interest in The Taubman Realty Group, or TRG, which owns 24 regional, super-regional, and outlet malls in the U.S. and Asia. Additionally, at December 31, 2023, we had a 22.4% ownership interest in Klépierre, a publicly traded, Paris-based real estate company, which owns shopping centers in 14 European countries.
Simon is without question the premier owner of shopping malls and similar retail properties. Some key aspects not needing detailed discussion:
A credit rating of A- or equivalent from Standard & Poor’s and from Moody’s
A massive cushion relative to their debt covenants (which they disclose up front)
Liquidity of nearly $11B against total, pro-rata debt of $32B
Simon is also one of the few REITs with a weighted average debt maturity that exceeds their weighted average lease term
Minimal issuance of common stock for the past decade (6.4% total dilution)
The need for pro-rata analysis is important. Simon has a very large number of Joint Ventures or JVs.
They ramped these up after 2010. It helps control risk as none of the JV debt (26% of the pro-rata total) is recourse to Simon.
But the presence of these JVs complicates the analysis. One has to find and use pro-rata numbers that include contributions from “noncontrolling interests” and from the JVs. Fortunately, Simon provides a lot of this in their Supplementals.
These details invalidate a lot of the analysis one sees on this company. Those analysts and their computers also often miss the multiple classes of ownership, so they get the effective number of shares wrong too. For example, TIKR does this.
Leasing and E-commerce Narratives
During the pandemic (and before) there was a lot of debate about malls and their future. One of those arguments involving three or four of us analysts was focused on leasing.
The advocate that e-commerce was the entire future of shopping was pounding the table that Simon would never again see leasing spreads as large as 10%. Well, here is what David Simon said on the recent earnings call:
our new deals are $74 a foot thereabouts, our renewals are $65 a foot, our expiring leases this year in the $56 - $57 range.
The implication is that they are getting 20% leasing spreads on renewals and twice that for new tenants. How did that happen?
In part, it happened because digital natives have been opening brick and mortar stores like mad. Why are they doing that? Here is David’s take:
don't get me wrong e-commerce is critically important, but all of this stuff about e-commerce, cost of customer acquisition, returns, stickiness, et cetera, all continues to be a challenge. If you looked at the marketplaces, that pure online, they run into problems. So they really need to be connected to a bricks and mortar for survivability.
David is not being original here in the least. If you follow the retail trade press, you’ve known all that for years.
Here is relevant material from a piece by Daphne Howland a year ago in Retail Dive [emphasis added]:
“Expanding what turns out to be, for many digital natives, a niche customer base is getting harder as venture capital money has dried up and customer acquisition costs have soared,” Rick Watson, [founder and CEO of RMW Commerce Consulting,] also said. Fundamentally, more of these companies, including of late Thirteen Lune, Our Place and Vuori, realize the tweak they need most is selling through brick and mortar.
“Regardless of the model that a DTC adopts, the math simply doesn’t support an online pure-play retail model of any kind that can be sustained against those that have a physical presence and can copy whatever someone else does online,” Forrester Principal Analyst Brendan Witcher said by email. “Not enough consumers have shown the propensity to remain long-term, loyal customers of a pure-play, online-only retailer. If they did, these companies would not have to spend the millions of dollars in advertising and marketing that wipe out their profitability.”
In the trade press and in retail-focused webinars by Placer.ai you can hear from experts whose success depends on getting retail right. I will share with you only one more of the many quotes I have been spooling away all making similar points. Here is the editor of Retail Dive just a few days ago:
E-commerce sales growth has slowed [since the pandemic]…. DTC brands with fitting pandemic assortments, like sleepwear brand Lunya, have since filed for bankruptcy. E-commerce is still a critical piece of the retail industry, but the pandemic promise of an online takeover didn’t quite pan out that way.
This is a sharp contrast to listening to major media authors whose success depends mainly on generating clicks. And that seems to be what many analysts use as a source.
Here is on case: this article used Warby Parker as an example of a digital native firm that was “straining malls.” Yet Warby Parker has long been opening physical stores, now has 200, and does 90% of their sales through them. [That article in my opinion has much else wrong about the history of malls and the retail crisis after 2016.]
I addressed some of the historical issues in Retail Apocalypse Not more than four years ago. But that article got no cogent criticism of the main points; people just make assumptions based on limited information without doing any research.
[Full disclosure: I took a modest loss overall on mall investments across that era, as discussed here. In retrospect, beyond things discussed there I misunderstood how important capex is for malls (see below).]
To re-emphasize the main point here: By now e-commerce is a tailwind and not a headwind for malls. It brings them a steady flow of new retail concepts ready to expand into physical stores. Ignore any author who has not figured this out.
First Find the NOI At Share
Simon provides a nice pro-rata (i.e., at share) report of NOI in their 8-K Supplementals. Here is the current one:
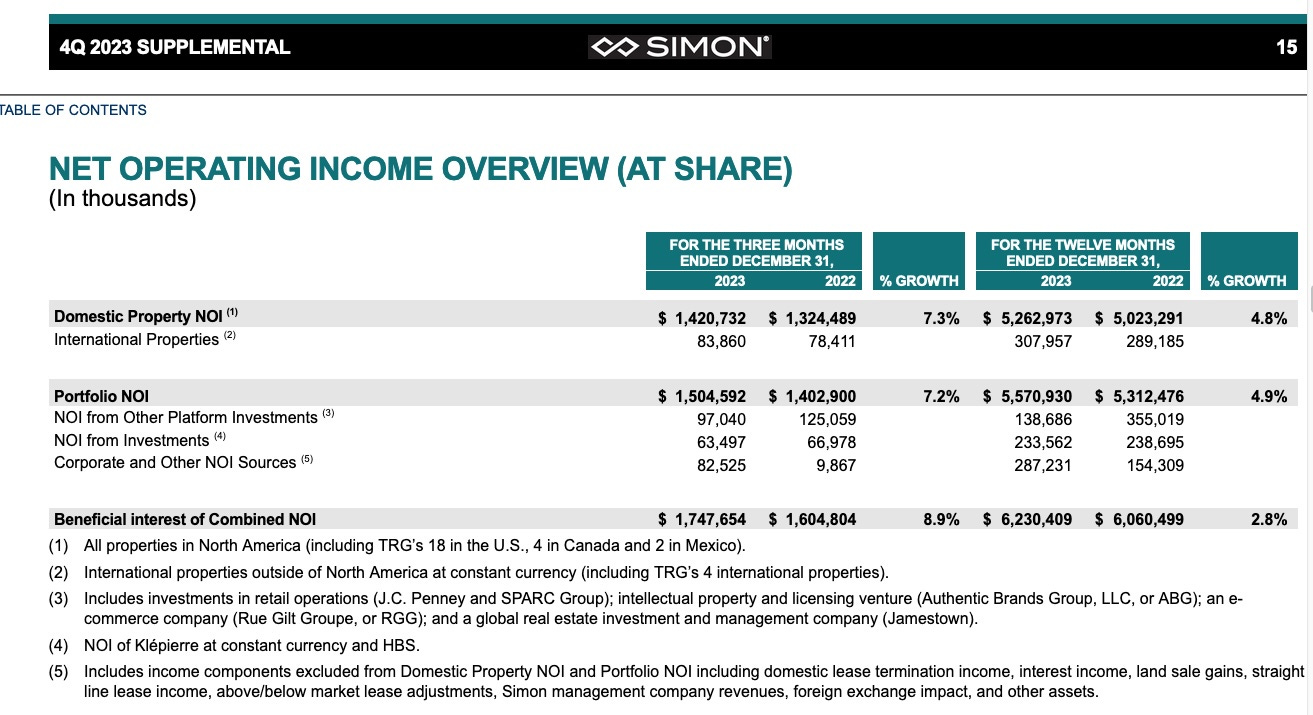
You can see that NOI increased overall and from most categories. The only significant drop was from the Other Platform Investments, on which more below.
You can also see that more than 80% of their total NOI is from their Domestic Property portfolio. Other things matter, especially for growth, but those domestic properties are the core of their earnings.
If you poke around in the filings, you can find the non-cash GAAP items that sometimes wreak havoc, such as straight-line rent, are small for Simon. So I ignored these and will use the reported numbers as decent approximations to cash values.
We can display the longer-term trends in NOI graphically like this:
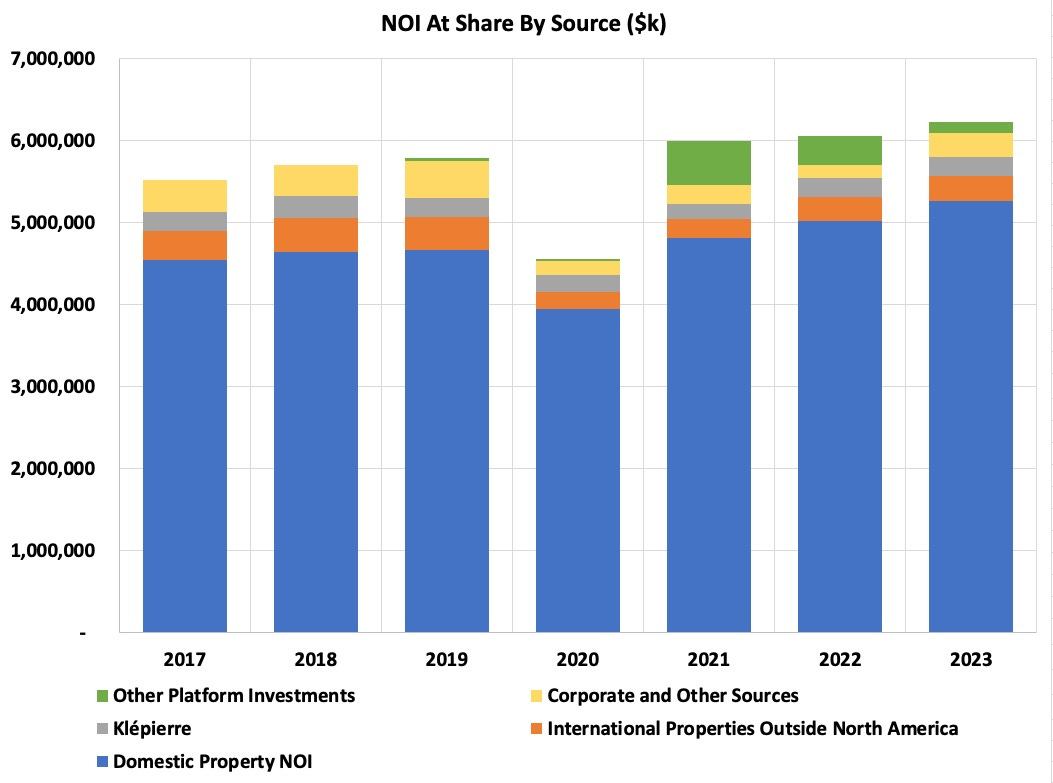
Some aspects of the trends seen here are worth noting. First, the pandemic now looks like just a blip. The long-term, overall upward trend is clear.
Second, Domestic Property NOI is now well (13%) above its pre-pandemic value. The other sources of NOI save for Other Platform, however, are fairly flat.
Overall these sources are down 24% compared to 2019, awaiting improved vigor in the world beyond North America. My view is that they provide some level of decorrelation with the US in the overall Simon portfolio.
The Other Platform Investments, which they call OPI, include investments in brand manager Authentic Brands and in specific brands such as J.C. Penney. Those contributed a lot in 2021, but the contributions have shrunk since. I reviewed the details in more depth last year.
The arc of these investments has been interesting. Simon bought them dirt cheap, mostly out of bankruptcy. I expect that when sold they will have produced excellent net gains.
But operationally they have exposed David Simon to how damn hard it is to turn around retail operations. He has progressed from having high optimism about being able to fix what was wrong with them to wondering in this last earnings call whether using their value to advance the main portfolio would produce more gains.
It will not surprise me if this chapter in the evolution of Simon ends soon. In any event, the OPI contribution to total NOI in 2023 was pretty negligible.
If you look at history, the total CAGR of Simon’s share of NOI from 2002 thru 2012 was 2.8%. From 2012 thru 2023 it was 2.9%.
These rates are far slower than the dividend growth at a CAGR of 8.4% from 2010 through 2023. We will ask below how much headroom there may be for dividend growth, but without question it must slow down in the long run.
Costs All Count
In finding NOI, Simon subtracts some costs. These can be inferred by comparing the Income Statement to the Reconciliation of NOI in their Supplemental.
Other costs remain, described here as Corporate Costs. As an investor, none of those costs can be spent improving the business or distributed to me, so I don’t care how anyone labels them. Here they are:
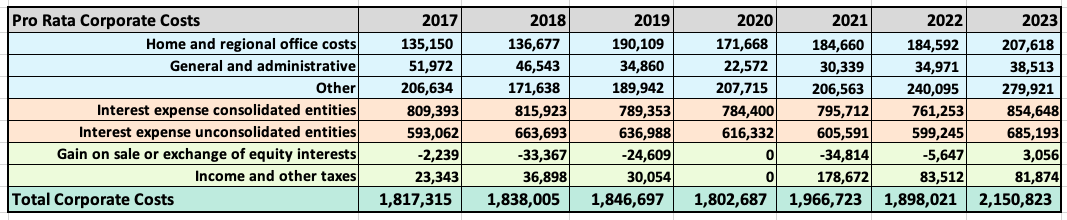
[Last year I wrongly included some costs that were in fact part of the evaluation of NOI. This year I used a spreadsheet that filled my full three-page monitor and looked in detail at all the reconciliations to make sure to get that right. But the net of the misidentified items was small.]
So one can find NOI less Corporate Costs. Simon’s total resources, however, are larger. Simon gets not only income but also distributions of capital from its unconsolidated interests (not shown in cash flows from operations or the income statement). We show that next.
Free Cash Flow! What?
The standard definition of FCF is Cash from Operations minus all capex. For many REITs FCF is smaller than the dividends, leading uninformed analysts to declare that they are adding debt to pay for the dividend. I discussed how silly this is here.
In fact it almost never makes sense to look at Free Cash Flow, or FCF, for REITs. That is for two reasons.
One is because they routinely add debt and often issue stock to support capex for growth. Another is that much of their growth capex is optional. They can and do ramp it up and down (mostly down lately) as market conditions change.
But this story is different for malls. Capex used to build new malls is growth capex in the traditional sense. But as a fraction, neither Simon nor any other REIT has much of that going on these days.
What does happen is that a lot of capex is needed to redevelop the spaces in malls for new tenants (and sometimes for other updating). These projects often generate gains but they are NOT optional. A lot of analysts including me did not really grasp this going into the pandemic.
In addition, Simon issues negligible amounts of stock and usually takes on very little debt. Putting this together with the capex story means that subtracting all capex from sources of cash produces a sensible measure of retained cash plus dividends for Simon.
Considering also those incoming capital distributions, it makes more sense to me to define Adjusted FCF as traditional FCF plus those distributions. Then things add up like this:
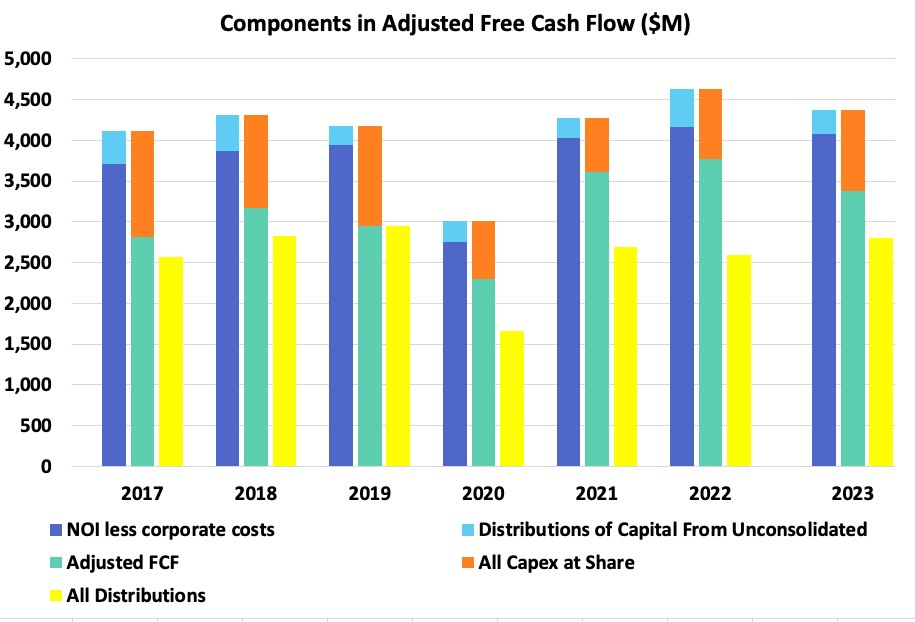
Consider 2023. The blue bars show that Simon had nearly $4.5B as the sum of NOI less Corporate Costs and incoming capital distributions. Subtracting the orange bar showing $1B of total capex, there was $3.5B of Adjusted FCF (teal bar).
You can see that the teal bar got shorter in 2023 compared to 2022. Both the Corporate Costs and the capex decreased. FCF dropped. The main culprit was interest expenses (see below).
The yellow bars show the distributions. Any difference from 100% is available for opportunistic investment such as buying companies.
Focusing on those teal and yellow bars, here is the payout ratio on Adjusted FCF:
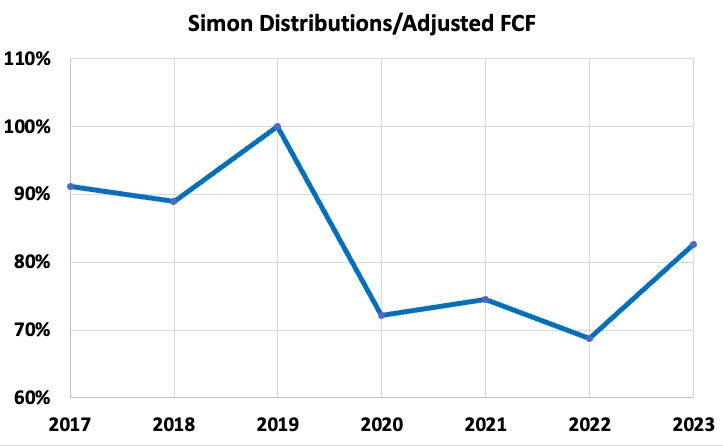
There are two things to say here. First, the remainder is in the ballpark of 15%, which implies that several hundred $M per year can be used on other initiatives.
Second, there is only limited room to raise the dividend and this implies limited room to grow the dividend. Without any increase in payout ratio, and if long-term NOI keeps growing as it has for more than 20 years, then the dividend can only grow in the long run at about the 3% increase in NOI.
If Simon pushes this payout ratio up into the 90% range over 5 years, they might have a 5% dividend growth rate for that period. But overall they have run out of room for rapid dividend growth.
What’s more, they are such a huge company for a REIT that there is just not much opportunity to move the needle faster. But we can find grounds for a little hope as follows.
Whence NOI Growth?
From the above, key to any long-term, higher rate of growth for dividends would be increasing the growth rate of FCF. Let’s probe that a bit.
As mentioned above, the total CAGR of Simon’s share of NOI from 2002 thru 2012 was 2.8%. From 2012 thru 2023 it was 2.9%.
Simon does not brag about any lease escalators, unlike say Federal Realty (FRT). So if they have them they are small. I did not find any mention of any in some earnings calls, 10-K and Supplemental filings.
Leasing spreads contribute to the NOI growth. Recent lease spreads are looking like 20%. Going back to the years leading up to 2017, before the retail challenges began, average spreads were running 15% to 20%.
Then they were less for about five years. That was a headwind.
Those are often 10-year leases, so the rent CAGR is between 1.5% and 2% for current lease spreads. Decreasing that are losses from any failed tenants. Increasing it is periods of stronger demand, which may be coming. Plus, if we enter an inflationary period, these rates should increase.
If such increases of NOI were not accompanied by any increases in other costs or interest rates, or reduced by rent losses, they would increase FCF by 4/3 as much. So call the contribution 2% but likely less.
So it looks like, long-term, the net contributions from other sources, less headwinds, have run 1% or a bit more.
Recent capex has been running at about 30% of FCF If that is invested at a return on equity of 5% you get 1.5% growth of FCF.
The few hundred $ M available for other investments are about 15% of FCF. These funds are invested in part in a wide range of technology and partnerships. If they return from 5% to 10%, they will contribute maybe 1.5% of FCF growth, or maybe half that, or maybe nothing.
So over time, the combined growth in FCF from invested funds would seem likely to end up near 2% and might hit 3%. The implied total growth rate of NOI and FCF of 4%, give or take 100 bps, is low for a solid REIT but not hugely so.
But that is before headwinds. At the moment those headwinds are increasing interest costs:
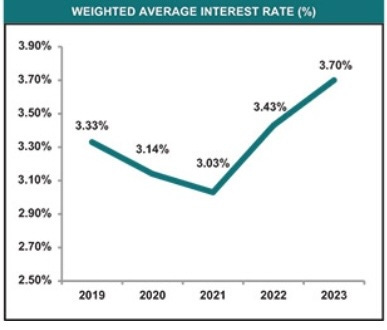
Note that 0.3% on the total debt would be a 3% increase in interest rates on the 10% of the total debt that might mature in any given year. The actual expirations are lumpy and the initial hit was larger as all variable-rate debt repriced immediately.
On their roughly $30B share of total debt, the continuing increases in interest costs will add about $100M to interest expenses each year. This is a hit of 3% of FCF (and again, lumpy).
In other words, at the moment the interest-rate headwinds are roughly wiping out the increase of FCF from investments. But looking further back it would seem that, over periods of a few years, there have always been headwinds.
With the recent improved context for retail, there could be better years ahead. But even if leasing spreads double to 40%, that would only add 2% to the growth rate.
As to interest rates, perhaps there will be tailwinds when (if) they come back down. But do you really expect to get back to the levels of 2021? I don’t. Reduced headwinds, at best, seem more likely to me.
It looks to me like achieving the historic rate of NOI growth near 3% is not unlikely, with year-to-year fluctuations. If that is what happens, it will place a hard cap on the dividend growth rate that is also near 3%, once the payout ratio reaches whatever maximum the Simon Board supports.
But There Was So Much Dividend Growth!
Alas, you can get fooled here the same way you can with Equity Lifestyle (ELS). Deep dividend cuts across the Great Recession enable spectacular dividend growth rates until the payout hits its limit.
For Simon I got fooled by the 8.4% CAGR for the dividend since the cut in 2010. What really happened was that the dividend doubled in four years and increased another 40% in the next three.
But in the six years since then it has grown only 4% on net. And as detailed above, a CAGR near 3% is what you should expect in the long run.
You might get another 10% jump soon, or perhaps 4% for awhile, but that is where this is headed.
Today the dividend yield is just over 5%. If we expect 3% dividend growth over time, the implied total return will be around 8%.
This is a not a large number for a REIT. From the perspective of competing for REIT investors’ money, Simon is probably a bit overpriced now (sorry David, but you are wrong).
Fair Price
The adjusted FCF for 2023 is about $9/share. NOI/sh is nearly twice that, as is not uncommon for REITs that must care for properties.
So the current price, near $150, is a P/FCF of about 16.7x. Let’s consider what a reasonable multiple would be.
My view is that Simon will keep going more or less forever. Malls in populous places will retain viability. And even their much-maligned outlet malls play an irreplaceable role in the retail ecosystem.
That 16.7x is a 6% discount rate on the earnings of Simon, only about 200 bps above the current 10-year Treasury rate. But if you do allow for a 2% growth rate, the discount rate becomes a more reasonable 8%.
It is hard to argue for a higher valuation (lower discount rate), unless that 10-year Treasury rate drops. A reasonable lower estimate on where it might go seems to me to be about 2%.
Then if the spread stayed the same (it might not), one might see 30% upside for SPG give or take, up to near $200. Might happen, but I’m not holding my breath for it.
Takeaways: What Now?
So far the lesson of 2024 for me is this. Not only can you be fooled by FFO/sh. You can be fooled by dividends and even at times by CfO/sh. For Simon in particular it was the dividend growth that had me fooled (should have known better).
It is cash NOI/sh that tells you best what the big picture is for long-term growth potential. Trends up or down from there in FCF and dividends will reflect changes in leverage and interest rates, mainly.
Plus, as the market translates earnings to a price, changes in that multiple have an impact. All the factors have been positive for most of this century, until recently.
There is a lot to be said for holding some SPG. It is a battleship of a REIT. Plus there is clear concern, expressed on earnings calls, to make decisions that are considerate of shareholder value.
Aside from temporarily during extreme economic events, the dividend is safe. And if it is cut it will come back. But even at the present price, the anticipated total return is low for a REIT.
I see Simon as an excellent purchase when the yield is 7% or more. But it is only so-so now near 5%, except as a stable portfolio anchor and income source.
There are a few other REITs that pay comparable yields and have better prospects for dividend growth. On net I see no strong need to reduce my holdings of SPG from here, but also little need to keep them as large as they are.
Just for fun I asked Claude.ai to summarize your article:
Here are the key points from the article on Simon Property Group:
1. Simon Property Group is a real estate investment trust (REIT) that owns and operates shopping malls and outlets in the United States.
2. The article raises concerns about the company's future growth prospects due to challenges facing the retail industry, particularly the shift towards e-commerce and the impact of the COVID-19 pandemic.
3. Simon Property Group's occupancy rates have declined in recent years, and the company has had to offer rent concessions to retain tenants, which has impacted its revenue and profitability.
4. The article questions the sustainability of Simon Property Group's dividend, which has been maintained at a high level despite the company's challenges.
5. The author argues that the company's strategy of acquiring distressed malls and redeveloping them may not be successful in the long run, as the retail industry continues to evolve and consumer shopping habits change.
6. The article also highlights the company's high debt levels and the risk of rising interest rates, which could further strain its financials.
7. Overall, the author suggests that investors should be cautious about investing in Simon Property Group, as the company's growth prospects are challenged, and its dividend may not be sustainable in the long run.
In summary, the article raises concerns about Simon Property Group's ability to adapt to the changing retail landscape and maintain its growth and profitability, given the challenges facing the mall and retail industry.
Not a very good summary in my opinion.
Nice article. Other than EPR, any others which might be a good swap for SPG? Also, why substack instead of SA for the article?