

Pricing Changes in Earnings


This article shares some perspectives on earnings multiples in the face of present and future changes in earnings. It ends discussing an excellent opportunity in the markets today.
This question came in from one of my members recently:
Paul how do you think about what multiple to pay for a business ? Dollar General fell 32% in one day. Now assuming the guidance low end pans out $5.30 would be the EPS. Now for a flat, non-growing possibly declining business but one that has some kind of moat in retail in rural America: how would you go about pricing it?
The usual measure of pricing is the P/E ratio, Price to GAAP Net Income per share (the usual EPS). Whether to use Net Income or something else is a complex question but we will go with that for the moment and discuss the question further below.
The P/E for Dollar General dropped from about 19x to 12.5x on that day. Longer-term, P/E is not back to its 2023 low when 10-year interest rates hit 5%:
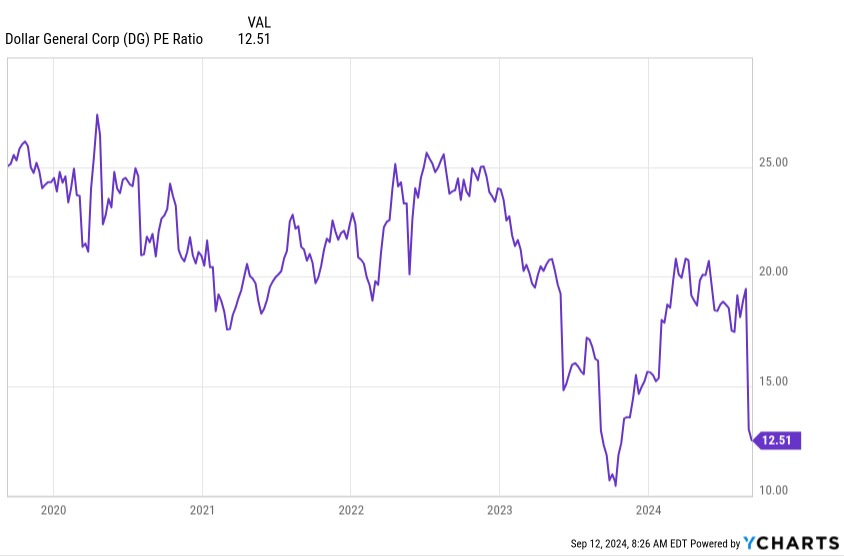
The change in guidance for EPS that catalyzed the recent change was about 20% . It may be more relevant that since the end of 2023, TTM EPS has dropped from about $10.50 to $6.50, a 38% drop.
And the low end of 2024 guidance is $5.30, a drop of about 50% and the stock price has dropped by 2/3. Market participants may have abandoned hope for a quick recovery.
Here we explore the related fundamental theory, mainly with graphics. Then we look at an application.
Discounted Cash Flows
Across the 20th century, investors came to appreciate that the value of a business is the value of all its future earnings, discounted appropriately to allow for the time value of money. Thus earnings from each more-distant year provide less value today.
This calculation is a Discounted Cash Flow (DCF) calculation and the value it produces is a Net Present Value (NPV). These are both terms and acronyms one sees often.
If the discount rate is 10%, then earnings from:
next year are worth about 90% of those from this year
from year 7 are worth about half
from year 14 are worth a quarter
… and so on
Assuming the earnings are flat in time, forever, the NPV is the EPS divided by the discount rate, and so is 10x EPS for a 10% discount rate. That is to say, the fair-value P/E is 10.
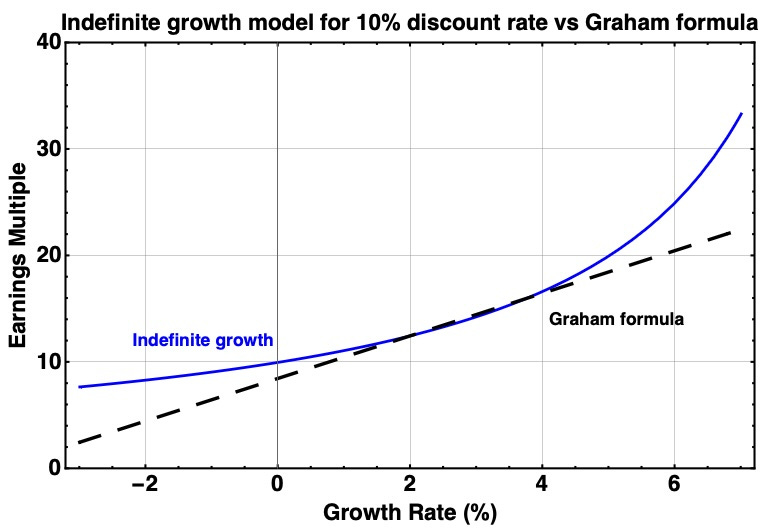
Benjamin Graham observed stock prices for several decades before publishing what is sometimes called the Graham formula. That formula finds the P/E for fair value as (8.5 + 2G), where G is the earnings growth rate in percent. Thus, the discount rate for zero growth is ~12%
The discount rate implied by this formula is about 10% at growth rates of 2% to 3% and increases for growth rates that are stronger or weaker. After its price drop, DG is at about a P/E of 12.5x, corresponding roughly to a 2% growth rate. Before the drop, the market was pricing in a rate of earnings growth in the 5% ballpark by this approach.
How to adjust valuation for a company with a great moat is more subjective. You might increase the valuation modestly by changing that 8.5 to a larger number or assuming a larger growth rate.
Whether to do that formally, or just use quality of moat to guide ranking of similar companies is another choice. My own preference is the latter.
Indefinite Growth
Another easy result to apply is the NPV for indefinite growth at a fixed rate, again G. The value, as a multiple of next-year’s earnings, is then 100/(10 - G). That 10 in the denominator is the discount rate, and can be adjusted. Plotting this:
We see that a multiple of 20x corresponds to about a 5% growth rate. The weakness of this formula is that the multiple goes to infinity as the growth rate approaches the discount rate.
The Graham formula avoids this. It is equivalent to steadily increasing the discount rate as earnings growth rates rise above 5%.
A higher discount rate does make sense for faster growers, whose future growth is far from assured. And there is another way to avoid infinities, which is to only include the growth over a selected number of years, as I illustrate below.
What Are Earnings, Anyway?
The calculation just described is based on “earnings,” but that leaves the question of what they are. They are not necessarily GAAP EPS. This question matters, a lot, for finding fair valuations.
In the first half of the 20th century, when DCF models began to be developed, earnings were considered to be only dividends. After all, you did not know whether the firm would have any value in the distant future.
Today we are in the age of buybacks, when investors are told that they are getting shareholder returns when management uses earnings to buy back stock. I don’t always object, especially if the buybacks support increases of per-share dividends, as is the case with Canadian Natural Resources (CNQ).
But anyone who tells you that the buybacks have the same value as dividends is selling you a bill of goods. The value must be discounted against adverse changes in stock pricing.
These changes can occur across the broad markets but also in any one stock. Here is what has happened to DG:
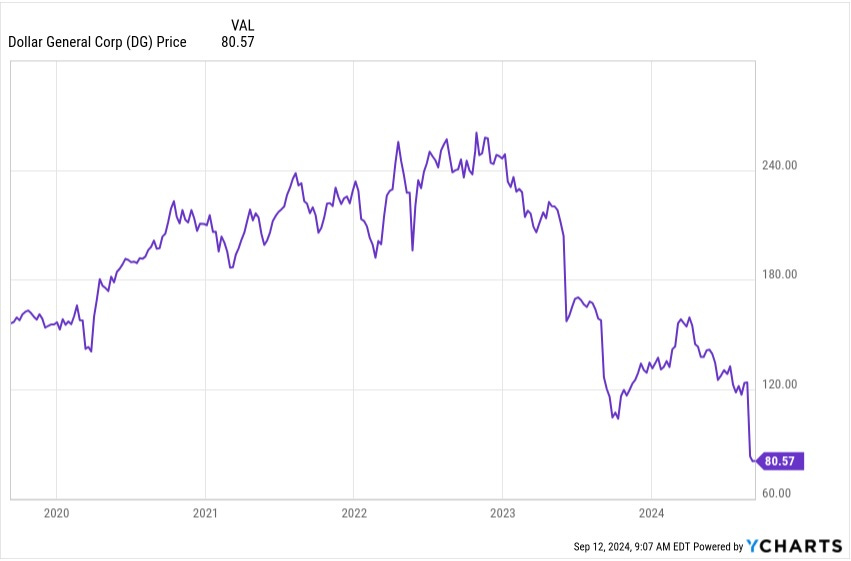
DG does pay a dividend, about 1% of that $240 peak price. So since 2019 a bit more than $10. They also bought back 18% of their stock during 2020 thru 2023. If they had used those funds for dividends, that total would be about $40.
Instead, the fat and happy buyback advocates found themselves up about $90 in value from 2019 to late 2023. Then the stock price dropped 3x.
So much for those ficticious gains. I don’t have a rule for how much to discount buybacks, but suggest that you not pretend they represent enduring value like cash in hand does.
Sometimes economic developments destroy shareholder value. Sometime companies make decisions that do so. Buffet’s point that every company will some day be run by an idiot rings true.
The next complication is that GAAP earnings are not cash earnings. The best quick substitute is Cash from Operations.
After dividends and buybacks, the remainder of cash generated is retained earnings. But all those cash earnings do not support growth. Some is needed for expenditures that maintain the earnings. The part that should not be viewed as increasing shareholder value.
I grapple with all this in every deep dive I write. So we won’t spend more time on it here. Just be aware.
For the rest of this article we will just discuss “earnings multiples.” Whether that should be viewed as a multiple on EPS, on Cash from Operations, on Funds Available for Distribution (my preference), or on something else is up to you.
Defining the Future
Whatever valuation method you use reflects (or assumes) that future earnings are known. One can’t really avoid this but should bear it in mind.
As an example, when energy investor Michael Boyd values exploration and production companies, he usually assumes that the earnings go to zero after a decade (or some other interval that reflects their details). In contrast, when he values midstream energy companies he models the next decade or two explicitly and then assumes a slow rate of earnings growth after that.
One reason that calculations of NPV are uncertain is that those future earnings are uncertain. We will see shortly how this plays out.
Finite Years of Growth
A common way to evaluate the NPV multiple for actual companies is to use a growth model for some finite number of years, as just mentioned for certain energy companies. This next plot discounts future earnings at 10%, just as in the example above. You get this:
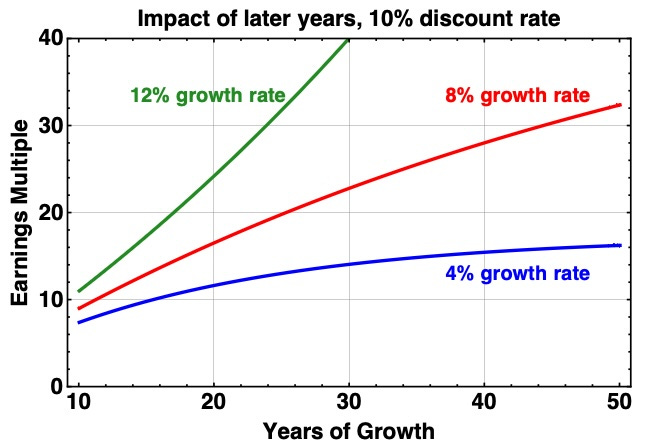
What always amazes me when I plot this is how many years of growth must be assumed to support large earnings multiples. If we think only 10 years is assured then the multiple is not far from 10x for all growth rates shown.
Pricing a stock at 30x earnings requires wearing rose-colored glasses unless you expect the company to sustain extremely high growth rates. To make 30x sensible, growth at 12% must continue for more than 20 years and 8% growth requires more than 40 years.
Yet almost none of the companies with the 20 largest market caps 20 years ago are still on that list. In nearly all cases, growth has slowed.
Now focus on the red curve showing a growth rate of 4%, a common rate for REITs (although the best ones can exceed 6% long-term). For that 4% growth rate, it takes 20 years to get the multiple up to 12x.
And you can’t get into the high teens or higher, where a lot of them were priced in 2021. The way to get to higher values is to lower the discount rate below 10%. This seemed plausible during the era of extremely low rates.
You can take this approach at your own risk. As to me, I took my gains in positions that got up to 30x or so. For example, I sold Camden Property Trust (CPT) at about $170 in late 2021, and got back in last fall below $90.
Abrupt Earnings Changes
One can observe that the market tends to move stock prices fairly closely with earnings. This does make some sense. If the earnings multiple does not change, then each year of earnings resets the calculated value (NPV) of all future earnings going forward.
But how do you know if the market overdoes it? Let’s look at two cases.
First, earnings may be growing at some rate, take a “one-time” drop, and then go back to growing.
Here is what you get as the size of a one-time drop increases, occurring after one year, with growth returning to trend after that through year 20, when it drops to 3%:
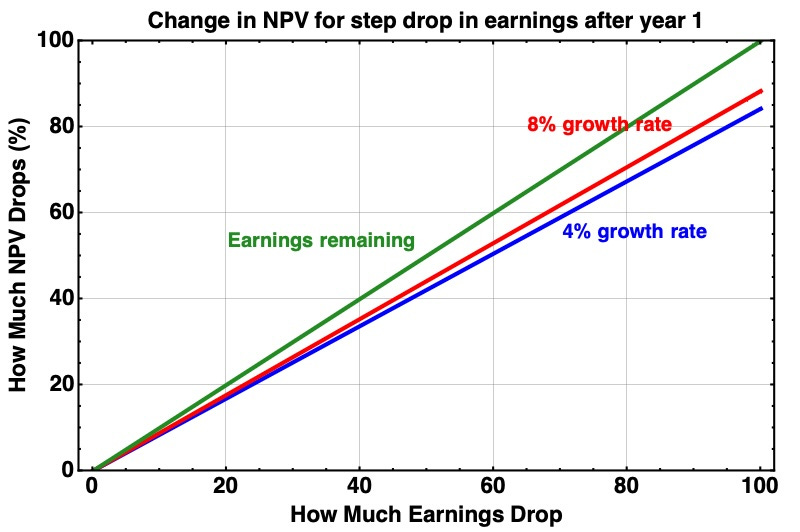
You can see that the NPV does indeed drop about as much as the earnings. (Actually a bit less but not enough to distinguish in practice.) So seeing the market move in proportion to earnings changes is sensible.
On top of that, larger changes may reflect a changed view about forward growth rates. Certainly for DG, it is far from clear that their earnings have found a bottom.
The price of DG is back where it was near the start of 2018, as is the forward EPS. So one might think they could turn around and go up.
But looking a bit further, one sees that they doubled their long-term debt from 2020 through 2023. Their interest expenses tripled.
My view is that those individual stores are in most cases viable. But that does not preclude major corporate problems.
DG can’t go back to Kansas. No clue here whether they can find the yellow brick road.
Cyclical Earnings
In contrast with earnings that generally grow but sometimes drop, there are sectors where earnings go through cycles. Anything involving commodities tends to be in this group.
This is where one can find some real dislocations in market pricing. The market often over-reacts as prices move below or above midcycle values.
We will look at the implications of a 100% variation in earnings, like this:
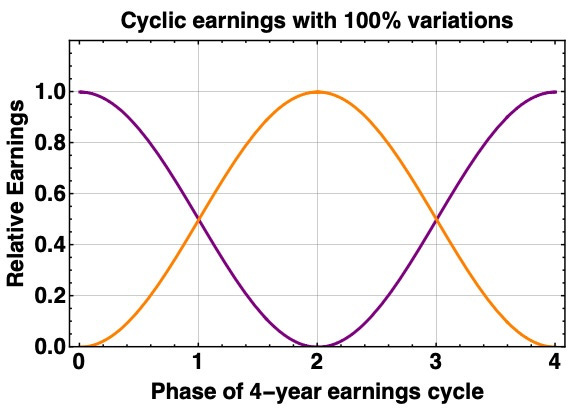
These cycles are often several years long; this example uses four years. And they certainly are not strictly sinusoidal in shape, but the curves shown capture the main trends. The two curves show two different starting points on the cycle.
Now we can look at the NPV on midcycle earnings, and how it depends on the phase of the cycle and the growth rate. The next plot assumes growth of midcycle earnings for 20 years, and zero earnings after that.
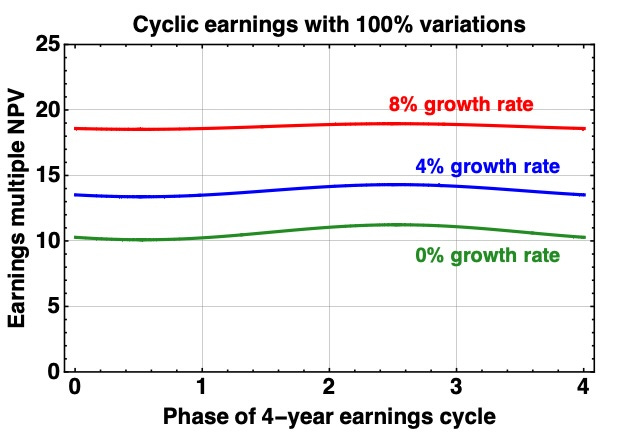
What we see is that the NPV for a 0% growth rate of midcycle earnings varies by ± 7% over the full cycle, from 10x to 11.3x. The fractional variations are smaller if there is long-term growth of midcycle earnings.
So here is where we can make some money.
What is quite remarkable is that the markets regularly give you opportunities to achieve your investing goals by buying stocks in solid, often investment-grade companies at discounts that are nothing short of silly.
During 2022 we saw similar opportunities in the REIT space, when REIT prices were hammered as interest rates rocketed upward. I made good money and/or obtained good income from Simon Property Group (SPG) and EPR Properties (EPR), in particular.
At Focused Investing, one of my goals is to find such opportunities and share them with members. A discussion of a current opportunity follows.