


Permian Resources

Permian Resources (PR) has become quite popular lately, with a lot of articles pumping the stock. At the end of the day, the main question is the rock.
Popularity prompts skepticism from me. This kind of price chart increases that:
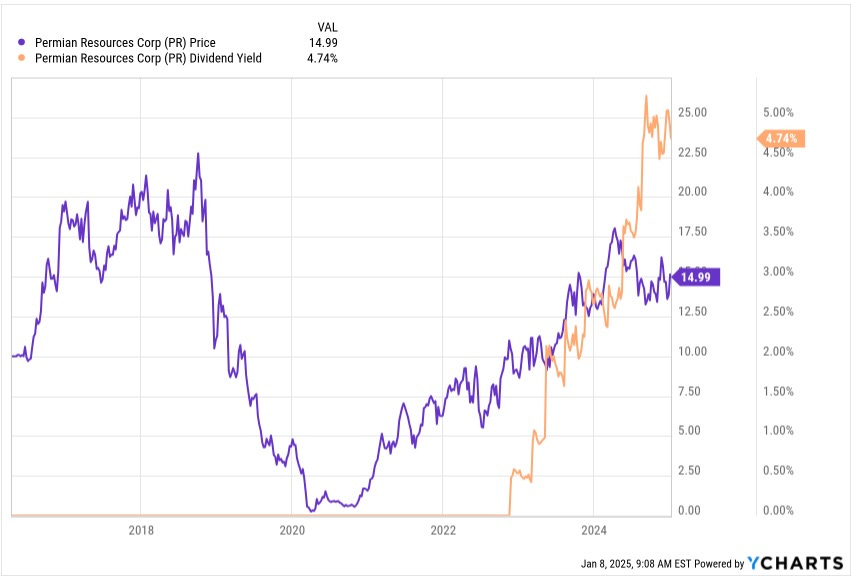
After 2017, the share count increased by no more than 12% each year until 2024, when it went up 50%. But the market pretty much gave them up for dead in 2019 and continuing into 2020, with the price dropping more than 60x from its high.
A lot of E&P oil companies did go bankrupt in 2020. But somehow PR did not.
Then the stock price began an enormous upward march that continued into early 2024. This may have been helped by the initiation of a dividend during 2023 and by its strong growth since.
The price today is down about 15% from its peak in early April. Sill, it is up 3x from early 2021 despite the huge increase in interest rates and significant dilution.
Is this justified? Let’s see.
Who Is Permian Resources Today?
A first thing is to take a look at their current Investor Presentation. And right there on page 2 is this map:
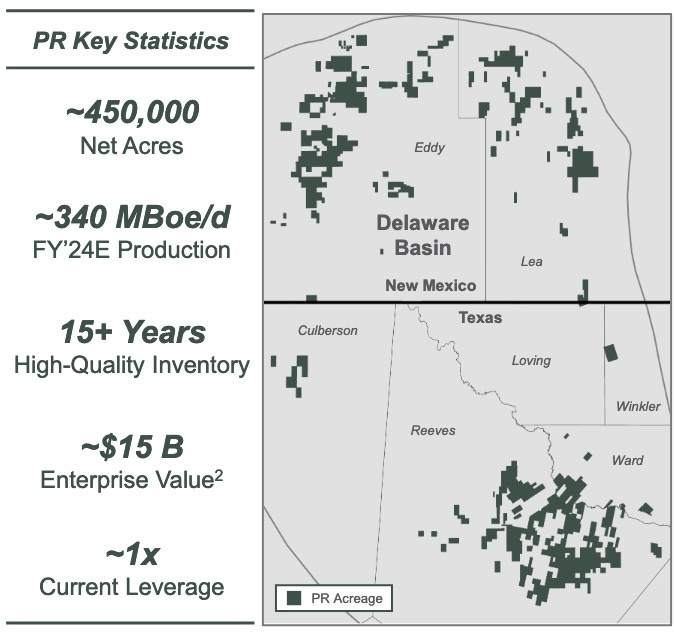
Well wow. All their property is around the edges of what I think of as the main Delaware basin.
The Permian overall has many stacked layers or “plays” where oil is found. Here is the RBN energy map illustrating the plays.
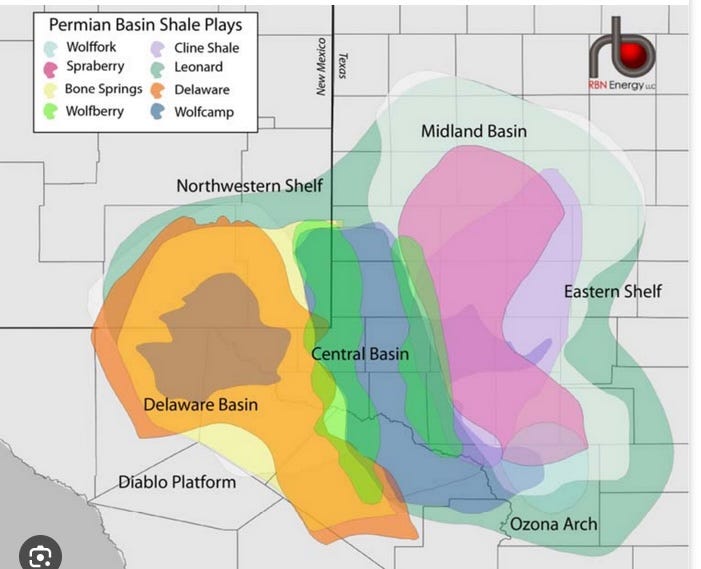
The rights in the core of the Delaware are today mostly owned by major players including EOG Resources (EOG) and Occidental Petroleum (OXY).
PR has been a consolidator, sweeping up firms operating around the edges of the main play. They’ve grown production to a high enough level that they can claim to be the “largest pure-play Delaware Basin E&P company.”
[Fans of the Taylor Sheridan TV series “Landman” may note the similarity, on a larger scale, to the strategy being employed by Cooper Norris to build his oil company.]
One wonders about the quality of those plays around the edges of the basin. If they were as good as the core, one would think they would be owned by the same firm.
Secondly, the subsurface geology of the Delaware is quite variable. So whatever technical approaches work best in one area, say to the southeast, are unlikely to work as well in others.
This perspective reflects a lot of reading on my part. But the details rapidly get beyond my personal level of expertise about the rock. What I do know says there is risk in this geometry and what I don’t know says maybe more than I think.
PR is aware of this but of course is strongly optimistic. This is from the Q3 2024 earnings call [edited for clarity]:
We are very specific to the different areas we're developing and what the rock needs. There's some [locations] on the Texas side, where you need to go co-complete all the different benches and that's the strategy that we execute there. As we move to New Mexico, there are some benches that that allow us to break different zones into different development packages. So that's what we'll do. We'll let the rock dictate what the right answer is.
This is necessary, but does not come for free either.
[Note: In December PR announced the sale of some midstream assets to Kinetik (KNTK). At $180M that was relatively small potatoes so we will ignore it here.]
Reading their SEC filings, their proved reserves, developed and undeveloped, represent about 7.5 years at current production. In claiming 15+ years of high-quality inventory (see the graphic above), they are being more aggressive than most firms. On the one hand, most producers do have inventory that is not proved. On the other hand, to my mind the risks mentioned above apply.
At least at present, PR seems committed to paying dividends going forward. On September 3 they announced a 150% increase to their prior base dividend, and also said the following (edited for length):
The Company’s approach to share buybacks will remain consistent with its historical strategy of focusing on opportunistic share repurchases.
“We have always believed that the base dividend is the most important and most efficient mechanism for returning cash to investors over time, and our updated dividend policy underscores that priority,” said James Walter, Co-CEO of Permian Resources. “Additionally, the revised return of capital strategy will provide better visibility for our shareholders to current and future dividends, while positioning Permian Resources to continue delivering strong dividend growth and leading total shareholder returns for years to come.”
“We are confident that our new base dividend is sustainable through future downcycles, which we define as being comfortably maintained for over two years at oil prices below $50 per barrel.”
On the one hand, this is music to my ears. But they have not been paying dividends very long. Companies can and do change their capital allocation policies.
PR has grown very aggressively, especially since 2020. We can see that in the cash flows:
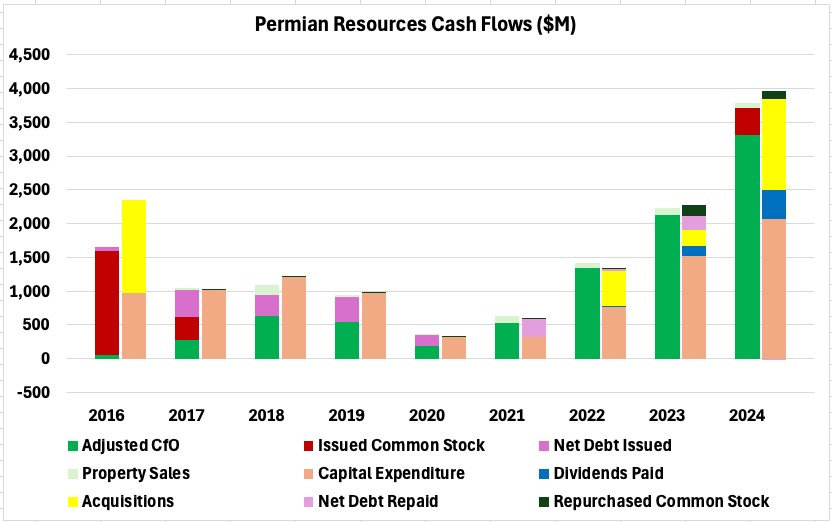
Here the left stacked bar in each pair shows sources of cash. You can see that this has dominantly been Cash from Operations, or CfO, adjusted to remove changes in working capital.
Prior to 2020 they added some debt (purple) to that. The right stacked bar shows capex for drilling and development in tan, and for cash acquisitions in yellow.
Since 2020 they have been rapidly increasing CfO even while paying down debt (light purple), starting a dividend (blue), and repurchasing shares (black). The growth has involved M&A in addition to outright acquisitions.
The main point is that PR has been growing total CfO very rapidly. What matters to shareholders, though, is how much per-share value was created and what happens next.
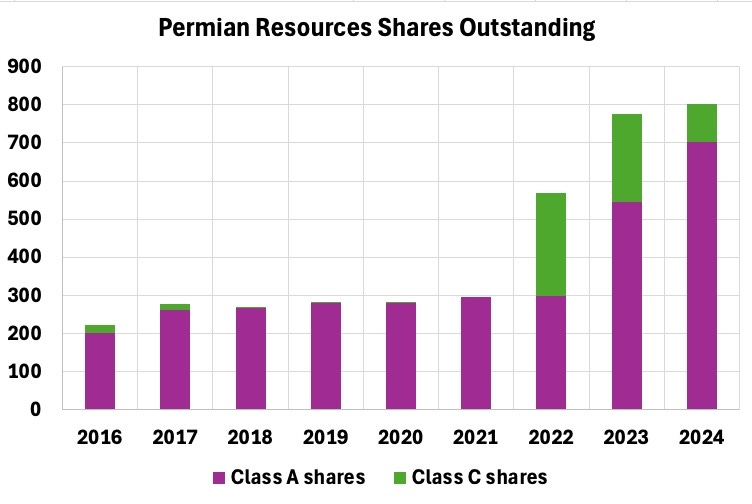
For M&A PR has often used Class C stock. These are shares of the OpCo and never mind the tax reasons for using them. They tend to convert to Class A shares fairly soon.
What matters to us is that neither TIKR nor YCHARTS is aware of these shares, so one has to do some legwork and be careful to avoid getting garbage out on per-share calculations. Here is the history:
Price and Earnings
Seeing a price chart like the one above takes me straight to the question of per-share earnings. Did these double over three years, to justify the doubling of the stock price?
Here are Adj. CfO/sh and FCF/sh. FCF is Free Cash Flow, defined as Adj. CfO/sh less all capex. Considering that the capex is largely necessary to sustain production, the meaning of FCF for an E&P is not too far from that of AFFO or FAD for a REIT or energy midstream.
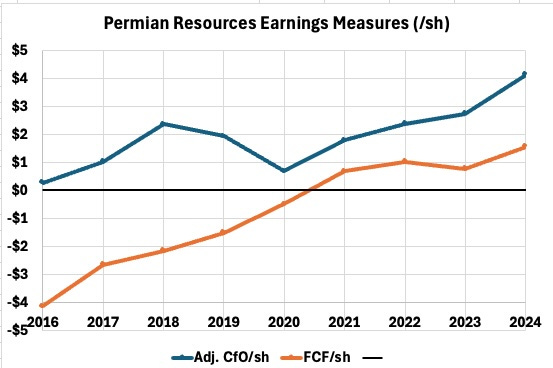
We see that CfO/sh has been growing at a nice clip since 2020, and did indeed nearly double over the past two years. But while FCF/sh has grown this past year, overall it has increased much less than CfO/sh. This reflects increasing capex as PR has obsessively focused on growing scale.
Overall, though, PR has indeed grown shareholder value at a good clip. Their claims that their acquisitions have been strongly accretive appear true.
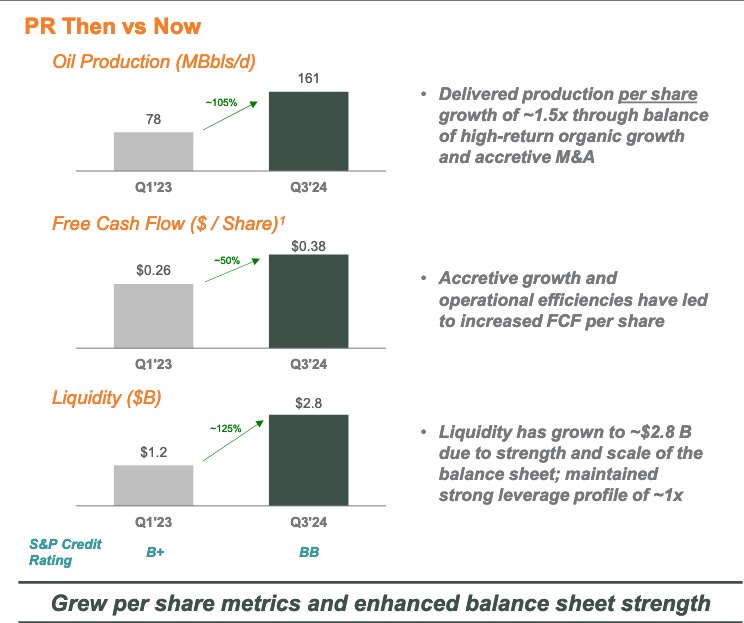
They highlight recent progress on this score by comparing numbers from Q1 2023 with those from Q3 2024 in this graphic:
Balance Sheet
The lowest row on that graphic relates to the balance sheet. With that change in scale, PR has indeed moved up two rungs on the credit-rating ladder, so that they are now BB.
PR says they are targeting investment grade ratings in 2025. Devon Energy (DVN) is at BBB to BBB+. They have about the same leverage as PR, but twice the Enterprise Value or EV. We’ll see what happens.
For PR Net Debt to EBITDAX has come down to 1.0x, again similar to that of Devon at 1.1x. For comparison, Chord is at 0.4x. But still, on the scale of the cash flows and of the liquidity, the $3.8B of total long-term debt for PR is not worrisome.