


Chord Energy

Buy? Sell? Hold? Taking a look at this company.
My first recent investment in Chord Energy (CHRD) started in August. I’ve added a couple times since, as it dropped further, so it is now a 4% portfolio position.
There was some material in an August Trade Alert about why. But recently a subscriber made me realize that I had not done a deeper workup on them. So here we go.
Should I sell? or invest more? Let’s see.
Introducing Chord Energy
Chord Energy (CHRD) is an E&P oil company focused on the Williston Basin within the Bakken, centered in western North Dakota. This is perhaps the second most productive basin in the US, after the Permian.
As I said in August,
I’ve paid attention to Chord for a long time. They were Oasis Petroleum before merging with Whiting Petroleum two years ago. Chord has long been focused on the Williston and has built scale, before and since, by effective mergers.
The result has been that they are now the largest producer in the Williston, by volumes and by well count. They have this acreage map and production mix:
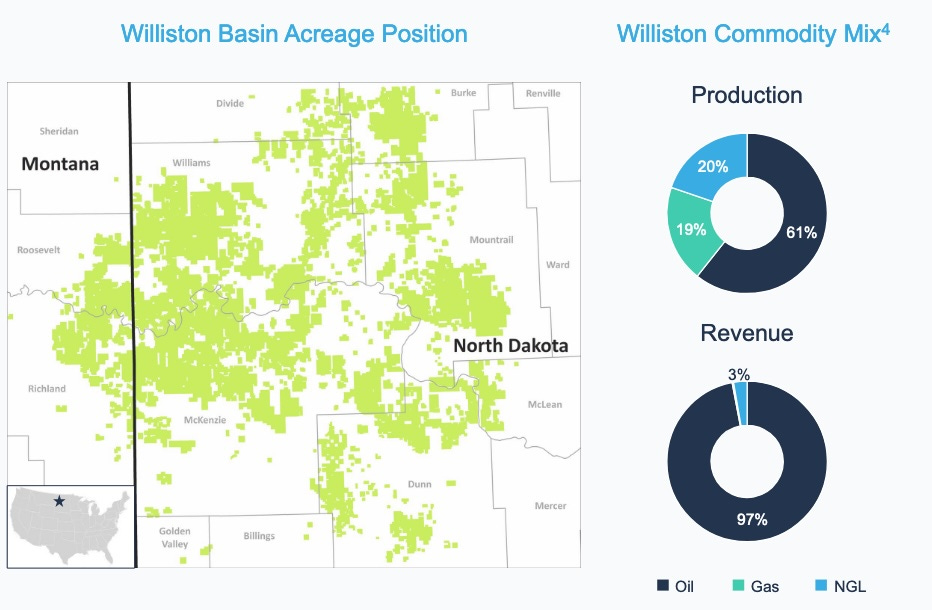
The Revenue, shown on the lower right, is completely dominated by oil sales. Production is shown by Barrel Of Energy, BOE, which is always misleading thanks to differences in the price of a BOE of one kind or another. It is remarkable how many analysts and investors get completely misled by this aspect. CHRD is an oil play, and little else.
The map has lots of large, contiguous areas, which enable modern long laterals. This lowers costs. Through 2027 they expect 50% of their wells drilled to be long (3 mile) laterals and are optimizing their spacing. Four-mile laterals are coming, too.
Their current investor presentation shows their specific versions of the usual results for all this. They are getting lower drilling costs, slower production declines, and larger cumulative oil production. I will show a couple aspects; there are more details in the presentation.
The challenge with longer laterals is to avoid a drop in well production from the later segments. Early efforts across the industry have often been challenged to manage this. Chord is succeeding; here is one of their graphics on longer laterals:
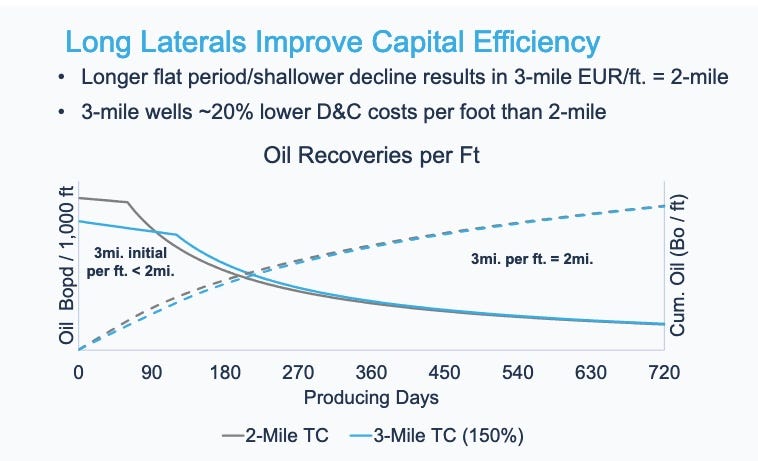
This plots oil per lateral foot. There is some initial difference in oil production (left scale, solid curves), but over time one ends up with the same cumulative total production (right scale, dashed curve).
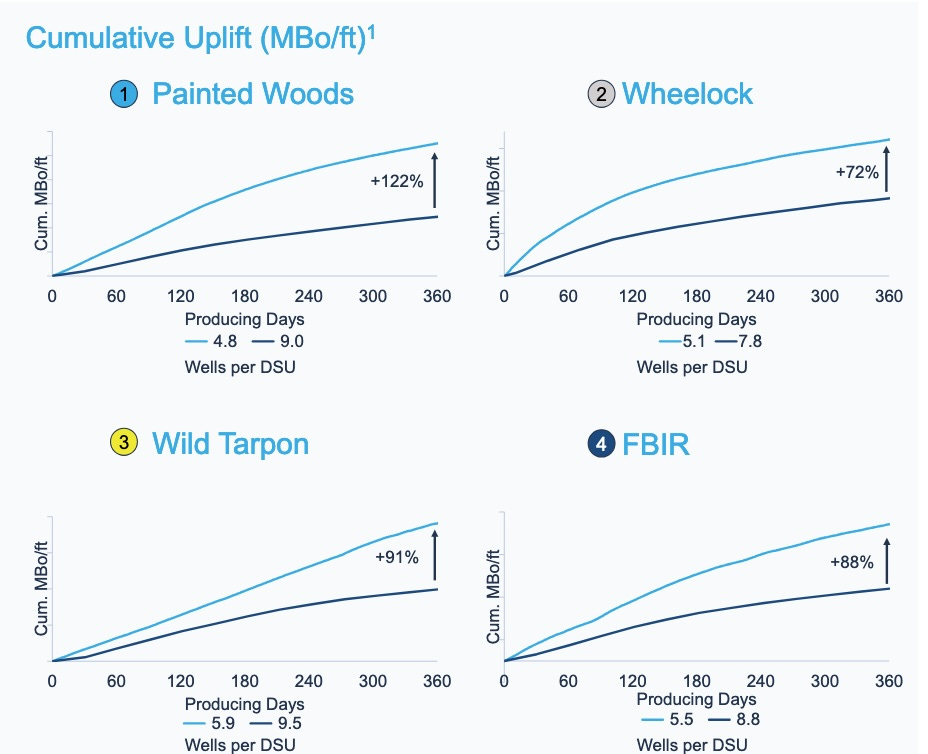
As to well spacing, here are results from four regions across their property map. In all cases the upper, blue curve has wider spacing (fewer wells per Drilling Spacing Unit) and sees significantly more cumulative production.
Overall, CHRD and one other firm drill with the lowest spacing among their peers ( CLR, COP, DVN, Grayson Mill, Hess, Kraken, MRO and XOM).
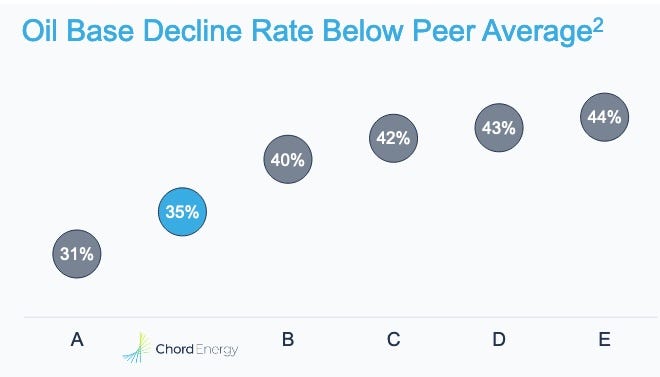
Lateral length, spacing, and other elements let Chord achieve a below average rate of decline in their oil base. Here peers are APA, CTRA, MRO, OVV and PR:
It is worth mentioning that these results are local for everybody. The rock varies and methods have to adapt. Chord does boast that in the Williston, the “suburface delivers reduced variability compared to other basins.” This reflects the geological reality that the Williston is a southern extension of the great WCSB that spans much of Western Canada.
During that period through 2027 their goal is to hold oil production flat at just over 150,000 Bopd. Sustaining this will require $1.4B of capex for 2025. The growth model is to drive down that capex via improvements in efficiency.
Chord has an inventory of low-breakeven well sites that will support 10 years of production at current rates. About two-thirds of these reserves are “proved developed” while one-third is “proved undeveloped.” (This is subject to updating in their next 10-K, to reflect acreage added this year.)
Chord also owns non-operated, natural gas wells in the Marcellus. That produces only a few percent of total revenues and we will ignore it.
Balance Sheet and Returns
Chord maintains low leverage, now at 0.3x (Net Debt/EBITDA). Their earliest maturity is $400M in June 2026. Their credit ratings are in the BB range, reflecting their small size. With their increased scale, they can hope for upgrades.
Chord does some hedging, at a low fraction of production. In bad times the proceeds will cover a multiple of the ongoing interest costs and presumably enable them to stay in business. But this is insurance; it is not trying to profit by guessing oil prices.
“Shareholder returns” are tied to leverage, as follows:
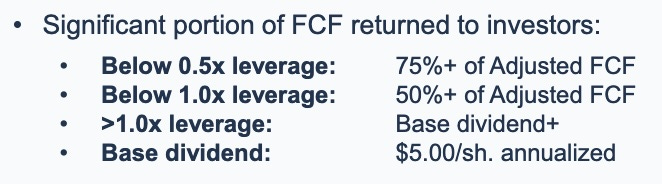
By now this kind of structure is qualitatively familiar. They express a “preference for share buybacks in current environment.” One always wonders whether “the current environment” includes management incentives that imply that they can line their pockets by doing buybacks.
The Chord cash flows are also very typical:
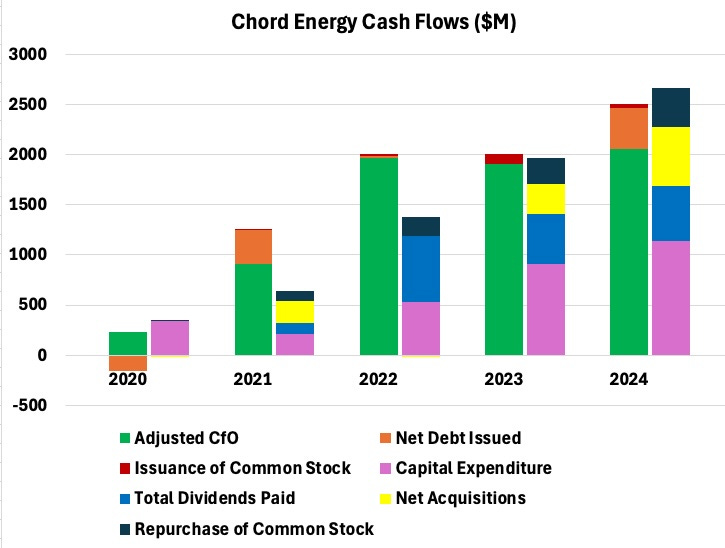
Sources of capital are shown in the left stacked bar of each pair. Mostly this is the green part showing Cash from Operations (CfO) less changes in working capital.
Substracting the capex (purple bar) from that gets you Free Cash Flow (FCF), which is strongly positive. It goes to dividends (blue), acquisitions (yellow), and sharebuybacks (black), sometimes with the help of added debt (orange). In 2024 the debt was added to support an acquisition.