


Checking in on Canadian Natural Resources

Canadian Natural Resources (CNQ) is an amazing company. I’ve described it as “my only dividend growth investment” and as “the only real growth stock in energy.” Here we check in on status and performance, to see whether or not those descriptions still apply.
All financial quantities are in Canadian dollars unless otherwise specified.
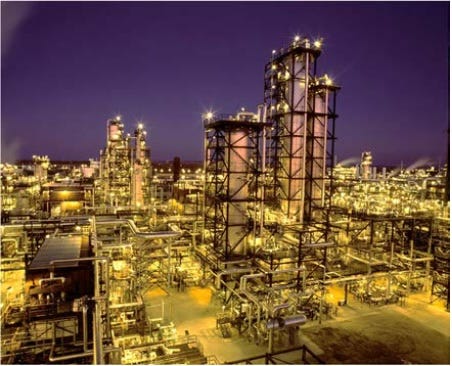
We will start with the big picture and then work our way into some of the details. Here is their overview of production, with the addition of product sales information:
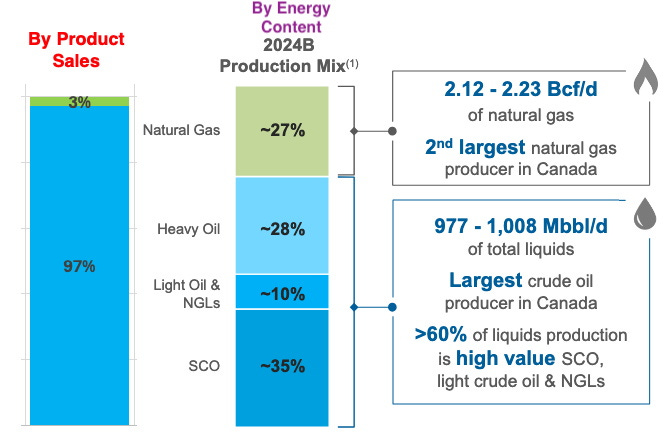
Several items here are notable.
The difference between the left and right stacked bar reflects the reality that it is much cheaper to buy a unit of energy as natural gas rather than as any sort of oil.
CNQ is the second largest natural gas producer in Canada anyway. But that is not their focus.
CNQ produces about a million barrels per day of crude oil and natural gas liquids (NGLs) and is the largest producer in Canada. So they are pushing 10% of the output from the famous Permian Basin in Texas and 1% of worldwide oil supply.
The oil comes in flavors that we will get to down below, including SCO.
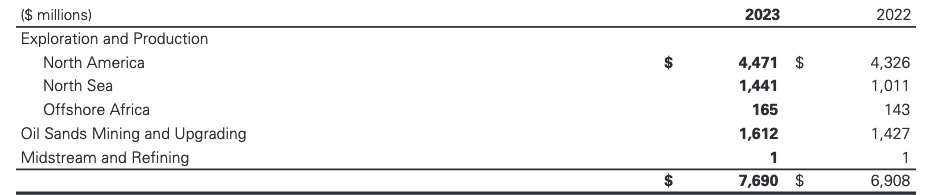
In oil production, the netback is the funds remaining after transportation, royalty, and production expenses. They split out the SCO in the annual report. Here is the summary for CNQ for 2023:
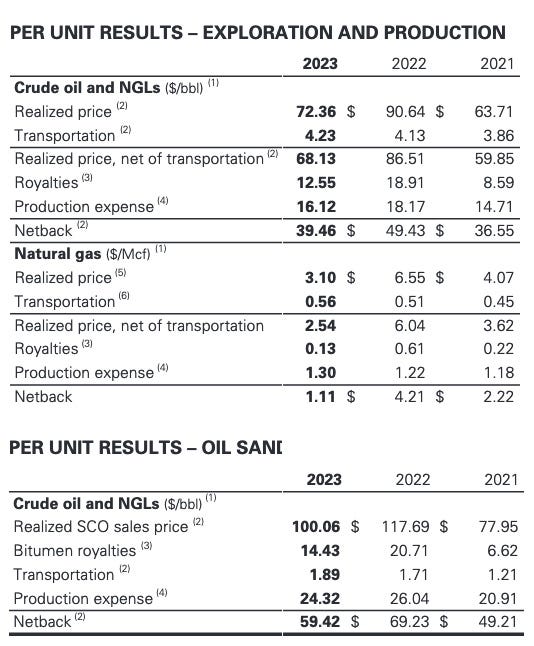
They made almost nothing on natural gas (and lost money in early 2024), but made about $30/bbl on crude oil and NGLs in 2023. On SCO they made about $40/bbl.
With total production not far from 1 MMbbl/day they get their annual cash flow near $15B. In the record year of 2022 when oil prices were higher, so was the cash flow.
The Cash Flow Story
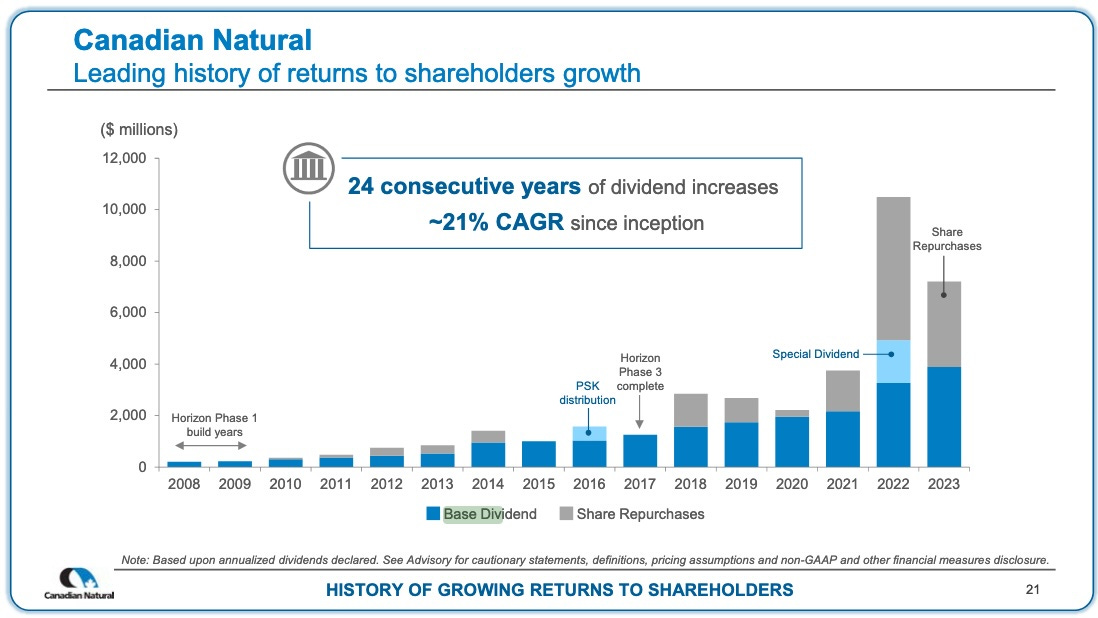
Since we are starting with the big picture we go straight to what they have done with their cash flows:
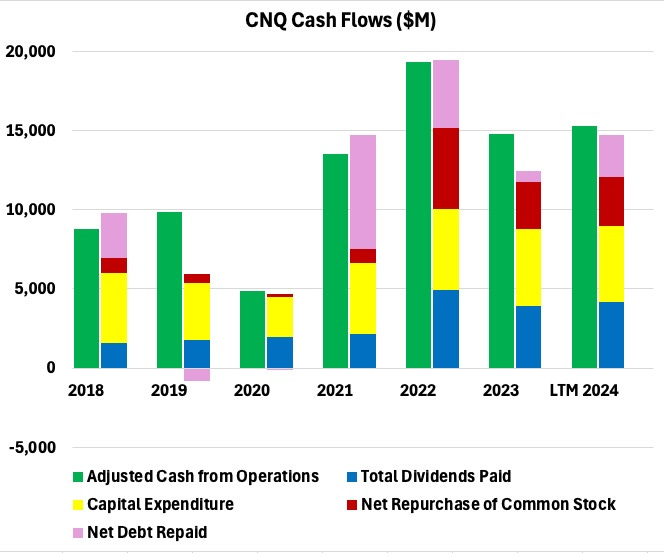
Here you can see Adjusted Cash from Operations (taking out changes in working capital) as the left stacked bar of each pair. CNQ further adjusts this to obtain “Adjusted funds flow” by subtracting abandonment expenditures, which run a few hundred $M, and “movements in other long-term assets,” which is small. These were ignored here.
The right stacked bar shows uses of funds. Debt paydown is in pink, but is just about finished (they are stopping at a debt of $10B) and should be much smaller going forward. Capex, in yellow, includes maintenance capex and growth capex. At the current spending rate of $5B per year they can grow production by a few percent per year.
The dividend (blue) and buybacks (red) have a symbiotic relationship. They are spending about $4B to buy back about 5% of the Market Cap and pay dividends at about a 5% yield. Note that this really got going only in 2022, once their debt had come down sufficiently.
The buybacks let them increase the per-share dividend 5% without spending any more total funds on dividend payouts. Then, on top of that, three things can let them grow the dividend more rapidly.
Increasing payout ratio. The payout ratio has increased over the past 8 years from 19% of Adj. CfO to 27%. This still has room to move up as their capex needs are modest.
Production increases. CNQ intends to increase production in proportion to the increase of egress from the WCSB (i.e., pipeline capacity and export facilities). This will be erratic, perhaps mid-single-digits on average. This adds a few percent to their likely dividend increases.
Periods of high oil prices. This led to a substantial special dividend in 2022.
Across 2023 they increased the base dividend by 18%. So far this year they increased it by 8% and their pattern has been to do a second raise for Q4.
The long-term CAGR of CNQ base dividends is near 20%. Perhaps they will continue that until the payout ratio reaches their maximum.
After that, both dividends and per-share cash flows still look to grow at high single digit rates. When earnings multiples are flat, that should have total return pushing 20%.
This is, in the words of Steve Jobs, insanely great. I never expected to see an energy company be in any way comparable to big growth firms. Wow.
Let’s look in more detail about what could disrupt this, how they do it, and where they are headed long-term.
Earnings Sensitivity
The primary determinant of earnings for oil production companies is of course oil prices. Old-timers will remember that getting oil from the oil sands was long considered the most expensive method by far. Not any more.
Canadian Natural shows a chart. Here is a look at the projection of their chart toward low oil prices:
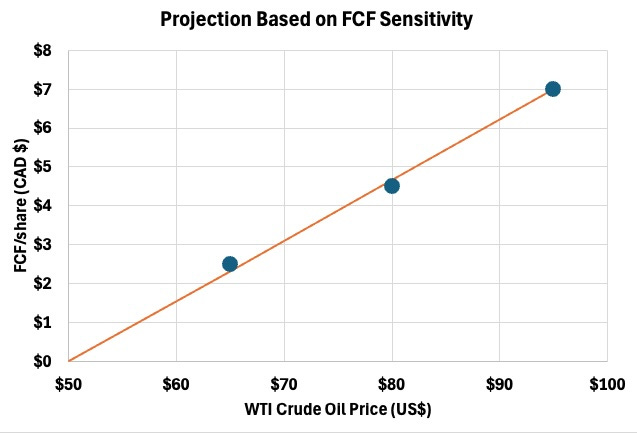
They could push the intercept below $50 by reducing capex. But hardly anybody in North America is making money at $50 oil, so they also might decide to just let debt increase through the low and then pay it back down.
It would surprise me, even then, if they cut the dividend. But one never knows. And a long enough period of $50 oil would make that more likely.
Sources of Oil
CNQ has very diverse sources of oil. Check this out, and especially the bottom part:
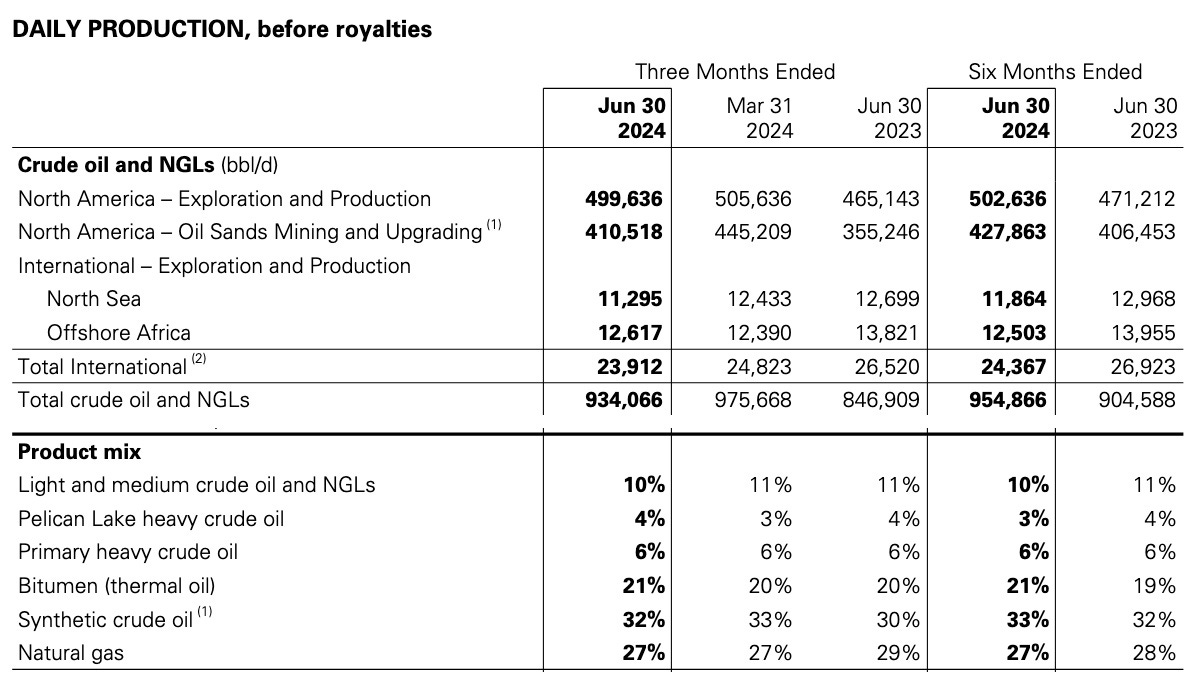
North American production is growing as a continuation of growth from recent years. Oil sands is down QoQ because of some maintenance activity.
Some comments on the small stuff:
International production is less than 3% of the total and we will ignore it.
The 10% light and medium crude oil and NGLs is from the Montney and the Alberta Deep Basin. They have 4,000 premium drilling locations there that can be flexibly accessed in response to market conditions.
The 10% heavy (flowing) crude oil is from central and eastern Alberta and Western Saskatchewan. They have more than 3,000 defined drilling locations and a large, concentrated land base that should yield much more.
Out of those 7,000 locations they will have drilled ~200 in 2024. That is an inventory of 35 years at present rates.
Bitumen
The oil sands are much like asphalt, and indeed the word used for asphalt in Britain is bitumen. That 21% of bitumen in the chart represents the “thermal” oil from the oil sands. To extract that oil, one requires enormous amounts of heat to make it flow (but see below).
CNQ produced 262 Mbbl/d in 2023 from this source. The proved and probable reserves are 5.2 billion barrels. That is a 54-year inventory.
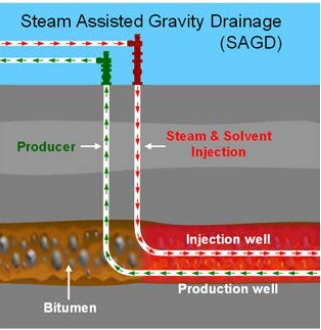
But CNQ has not been standing still using the old methods. They are enhancing recovery and reducing costs using methods they have researched and developed:
Cyclic Steam Stimulation
Steam Assisted Gravity Drainage (SAGD)
Steam Flood
Solvents
Their demonstration solvent SAGD system succeeded. It reduced the ratio of steam to oil (the key parameter for both cost and environmental impact) by 45%. Plus, they recovered 85% of the solvent for further use.
Here is their image of their first commercial-scale solvent SAGD pad:
They expect this to reduce operating costs by about $1/bbl. Over time they have been whittling away, finding one advance after another to drive down costs.
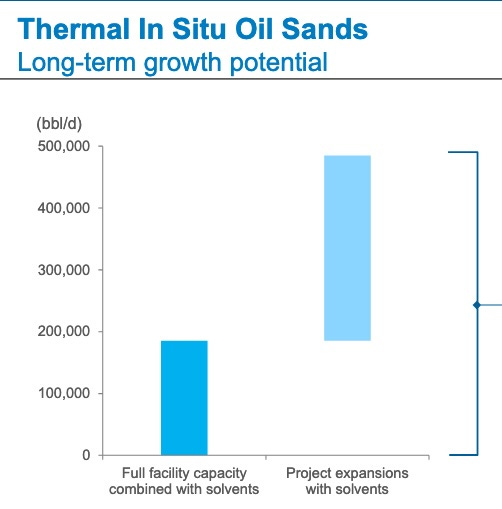
Here is how CNQ sees the potential for thermal oil expansions long-term, based on these new technologies:
Mining and Upgrading
Little has seemed more bizarre when I first learned of it than mining for oil. Oil is this stuff you put in barrels; how would you “mine” it?.
Since then I’ve encountered other fun corners of the very diverse types of crude oil. My favorite may be the yellow waxy crude oil in the Unita Basin in Utah.
If you think of the oil sands as asphalt, then the idea that you could grind up and mine their material seems similar to the milling of asphalt roads that has become common in the US. The end result, after “upgrading,” is Synthetic Crude Oil (SCO).
Upgrading transforms bitumen into light oil by fractionization (or cracking) and chemical treatment. This removes nearly all the sulphur and heavy metals, enabling further refining in simpler, less-expensive refineries.
Much of SCO is likely destined for Europe or elsewhere where such refineries are dominant. Much of the oil from shale is too.
The price of SCO is generally above that of WTI crude oil. Here are recent prices:
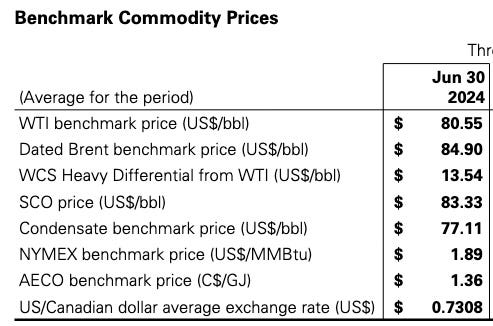
The SCO price is indeed above that of WTI. The “Differential” for WCS Heavy is the discount to WTI. The spreads here are often larger than we see at the moment, too.
What’s more, over the last decade CNQ has pushed down the operating costs per SCO barrell by 35%, to less than $25/bbl (18 US$). But they are not stopping there and instead are pushing forward on three new technologies.
First, they have a Naphtha Recovery Unit Tailings Treatment (NRUTT) Project. It will
Increase SCO production by 6.3 Mbbl/d.
Cost $350M
Avoid future reclamation costs of $700M
Begin operation in Q3 2027
Second, they have demonstrated their In-Pit Extraction Process (IPEP) with a successful pilot project. From Natural Resources Canada:
The In-Pit Extraction Process (IPEP) is an alternate bitumen extraction process that separates oil sands ore into coarse solids, fine solids, bitumen and water. The process takes place at the oil sands mine (in-pit) requiring fewer diesel haul trucks, auxiliary equipment, and thus reducing power needs and greenhouse gas (GHG) emissions.
What CNQ has to say is this: “IPEP is a relocatable, modular extraction plant that processes ore and separates bitumen in the mine pit.” The project produced dry stackable tailings in the mine pit.
A demonstration plant is in detailed design. The targeted operating cost savings is $1/bbl to $2/bbl.
Third, they are looking to add a Paraffinic Froth Treatment (PFT) element to IPEP. Here is a description from Oil Sands Magazine:
Froth Treatment is a process by which water and fine solids are removed from bitumen froth produced in Extraction using hydrocarbon-based gravity separation. In a Paraffinic Froth Treatment (PFT) facility, a paraffinic solvent is used as the diluent, producing a very clean final product that can be sold directly to market without an upgrading step.
Bitumen froth produced in Extraction is typically 60% bitumen, 30% water and 10% fine solids. This product requires further cleaning before the bitumen can be upgraded to crude oil or sold to market. Since no further cleaning can occur by water-based gravity separation, a light hydrocarbon is added to the froth in order to reduce viscosity of the bitumen and enable a more effective gravity separation. This process is typically referred to as Froth Treatment.
Since the diluted bitumen produced from a PFT facility has almost no water or solids, the product can be sold directly to a high-conversion refinery, without needing to be upgraded. Note that since PFT bitumen still contains about 10% asphaltenes and a significant amount of sulphur, this feedstock would not be suitable for a conventional refinery which is traditionally designed for light/sweet crude oil.
Geeking out a bit, this is a schematic of the PFT process:

In combination, the technologies just discussed will drive down both costs and environmental impact. Putting this together, here is the long-term vision:
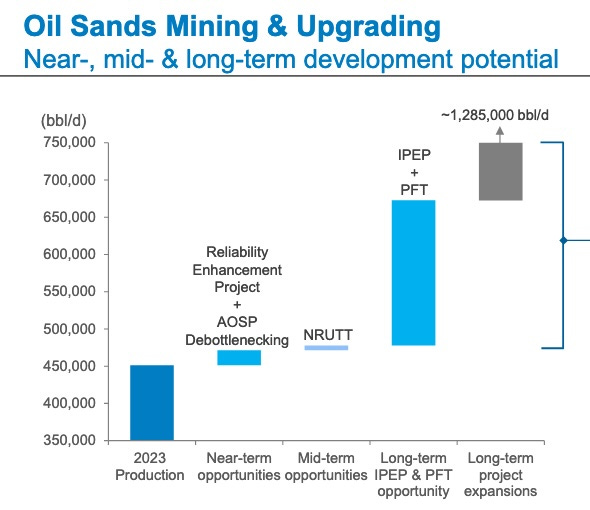
Note that they see an ultimate rate of production, from mining the oil sands alone, above their total current oil production from all sources today.
Inventory and Reserves
Here is some reorganized material from the current investor presentation about inventory and reserves. For all the inventory, the disclaimers are:
Development of remaining volume is subject to company final investment decisions
A portion of remaining volume may not be recoverable with current technology
All values are company gross
Thermal In Situ Oil Sands Overview – Clearwater, McMurray, Bluesky, Grand Rapids and Grosmont Formations
~126 billion barrels of Discovered Bitumen Initially-in-place is comprised of:
5.2 billion barrels of total proved plus probable reserves at December 31, 2023 that were evaluated in accordance to COGEH standards by an Independent Qualified Reserves Evaluator
1.4 billion barrels of produced Bitumen to December 31, 2023
Oil Sands Mining & Upgrading
~18.5 billion barrels of Mineable Bitumen Initially-in-place is comprised of:
8.1 billion barrels of Bitumen associated with 7.5 billion barrels of total proved plus probable SCO reserves at December 31, 2023 that were evaluated in accordance with COGEH standards by an Independent Qualified Reserves Evaluator
2.0 billion barrels of produced Bitumen to December 31, 2023
At the current production of nearly 1 MMbbl/d, they produce less than 400 million barrels per year. You can see why there are several decades of inventory, if not more.
Reclamation
From this source: “Canadian oil sands development is subject to some of the strictest environmental regulatory standards globally that require 100% land reclamation after operations cease. (Natural Resources Canada – NRC)”
So CNQ needs to plan for reclamation. In 2023, abandonment expenditures ran $509M. Looking ahead:
The Company’s asset retirement obligations are expected to be settled on an ongoing basis over a period of approximately 60 years and have been discounted using a weighted average discount rate of 5.2% (2022 – 5.6%; 2021 – 4.0%). For 2023, the Company’s capital expenditures included $509 million for abandonment expenditures (2022 – $449 million; 2021 – $307 million). The Company’s estimated discounted ARO at December 31, 2023 was as follows:
The discounted ARO was based on estimates of future costs to abandon and restore wells, production facilities, mine sites, upgrading facilities and tailings, and offshore production platforms.
Factors that affect costs include number of wells drilled, well depth, facility size and the specific environmental legislation. The estimated future costs are based on estimates of current costs in accordance with present legislation, industry operating practice as well as the expected work scope and the timing of abandonment.
The key point here is that these financial obligations are in total value less than half of one year’s CfO. They do not seem to be a large issue to me.
Takeaways
Canadian Natural Resources produces nearly 1 MMbbl/d, the largest among Canadian companies.
More than half that production is from the oil sands, either thermal oil or SCO. These are already competitive with other oil sources on a cost basis. Ongoing technological advances continue to drive down the production costs.
The business model involves growing the dividend through a combination of share buybacks and production increases. For reasonable oil prices (below likely midcycle values), total returns near 20% look feasible.
Dividend growth rates have run near 20% and seem poised to run above 10% going forward. The dividend yield will stay in the 5% ballpark if the stock price increases in proportion to cash flows.
I remain happily long CNQ with substantial gains and no intention to sell.
Appendix: Stock-Based Compensation
One of our members had heard that stock-based compensation (SBC) by CNQ was egregious, and asked that I include a look at it. This topic always makes me roll my eyes.
It seems like some people view any and all SBC as evil. In my view there are lots of reasons to do it, but that is not today’s question.
How much management is paying themselves matters little to me, so long as they are making me rich. On top of that, the Income Statement is full of crap, as usual, counting SBC as a cost when it is non-cash.
In contrast, if you focus on the Statements of Cash Flows, SBC is added back in as part of finding CfO. This is one more reason to prefer to look at cash flows.
The actual financial impact of SBC comes when the granted stock options are exercised. One can do complex forward modeling of that but what I do is to just look at the current rate of dilution caused by the ongoing exercise of these options.
So you can dig through the financial statements and find how many shares are being issued. For CNQ that was 11.6M in 2022 and 9.8M in 2023. That’s 0.5% and 0.4% of shares outstanding, respectively.
And in those years CNQ bought back 3.1% and 4.1% of shares outstanding, respectively. Are we supposed to be concerned about dilution from SBC at 10% or less of that level? Sorry, but good grief.
Thanks for doing such a thorough review of CNQ. I am holding strong!
Thank You That Was Really Well Done