


Briefer Note: Half a Look at Vicinity Centres

Not appealing from the amount of work I could easily put into it.
One of my subscribers, while enjoying vacation in Australia, also found himself enjoying a mall owned by Vicinity Centers (VCX:AX). He also found this plot, but only from 2020 forward:
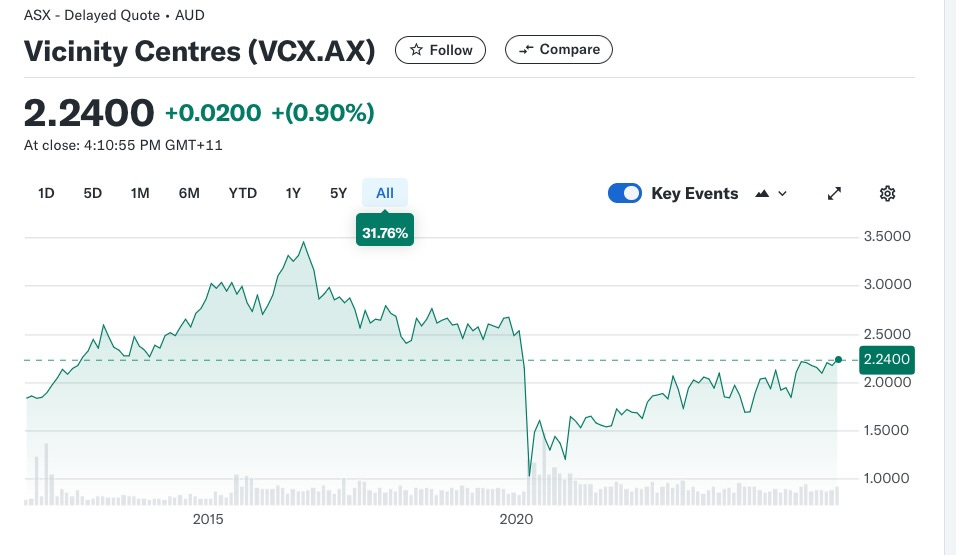
That looked pretty good, with a 2.2x gain in 5 years and with that gain being steady. The all time plot (nearly 15 years) is not as hopeful, but we do know that Australia strongly over-reacted to the pandemic. So perhaps this might be a worthwhile investment.
I spent some time on Vicinity, until reaching barriers I could not easily penetrate. In that process things did not look that favorable. If you want to go deeper than the shallow look shared below, more power to you.
I looked at their investor presentation and annual and half-year reports from this website. But there is an over-arching problem: about half their properties are in Joint Ventures (JVs) and disclosures about these are minimal.
In contrast, Simon Property Group (SPG) has excellent disclosures about their many JVs. Here are some of the things Simon puts in their 8-K that I did not find for Vicinity:
Net Operating Income — NOI — at share by sector
Breakdown of income and operating expenses for unconsolidated entities
Share of capital expenses for unconsolidated entities
Interest bearing liabilities (i.e. Debt) for the JVs
Ongoing expenses on JV activities
Capital payouts from JVs
I also ended up unsure about the meaning of their “gearing”, which the US would call a Debt Ratio. The “total tangible assets” they use clearly includes the unconsolidated JV properties, which one would not in the US. But does the debt include the debt from unconsolidated properties or not? This might be clearly stated somewhere, but I did not notice where.
So, if it is possible at all, it would be a lot more work to really understand Vicinity. Still, the overall, per-share, consolidated Cash from Operations (CfO) is relelevant:
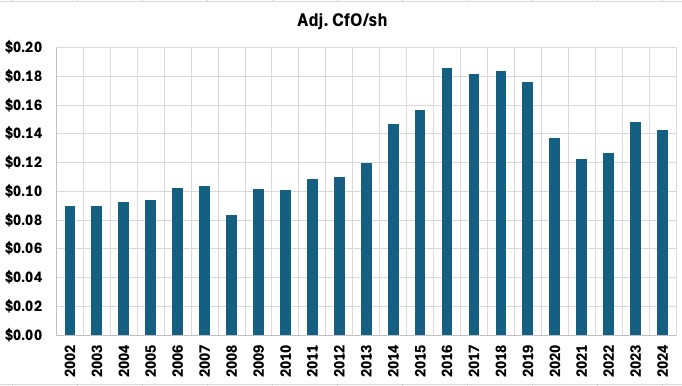
This reached a peak in the late 2010s but remains 20% below it. The share price is down a bit less.
On other item: I am confused by their capex. Their maintenance capex, at about 7% of FFO, is too low for malls.
And their total capex, including sustaining and devlopment spending, is comparable to NOI at $540M. This is very large but likely increased JV debt soaks up a lot of it. Again, though, it is hard to tell.
At least from things encountered, a lot of forward growth or forward upside from operations seems unlilkely. That’s beyond possible near-term gains from catching up on rent, which could run small tens of percents over several years.
That’s my report, such as it is. Buyer beware, and do more research.
Please click that ♡ button. And please subscribe, restack, and share. Thanks!
Thanks Paul, that quick research is highly appreciated. Looks like I don't need to be a shareholder to appreciate shopping at their malls.
I will keep in mind that having a simple structure (eg. JVs) and being more transparent in their presentations makes the investing decision easier.